
National Real Estate Commentary
U.S. existing-home sales were virtually unchanged from the previous month, dipping just 0.2% to a seasonally adjusted annual rate of 4.0 million units, according to the National Association of REALTORS® (NAR). Most of these transactions went under contract in June and July, when mortgage rates were 40 to 50 basis points higher than current levels. Year-over-year, sales increased 1.8%, with the strongest activity occurring in the Midwest, where the typical home price is 22% below the national median.
Nationally, housing inventory declined for the first time this year, slipping 1.3% month-over-month to 1.53 million units, representing a 4.6-month supply at the current sales pace, according to NAR. Despite the monthly drop, total inventory remained 11.7% higher than the same time last year. Meanwhile, the median existing home price rose 2% year-over-year to $422,600, though it was essentially flat compared to the prior month.
September-Local Activity
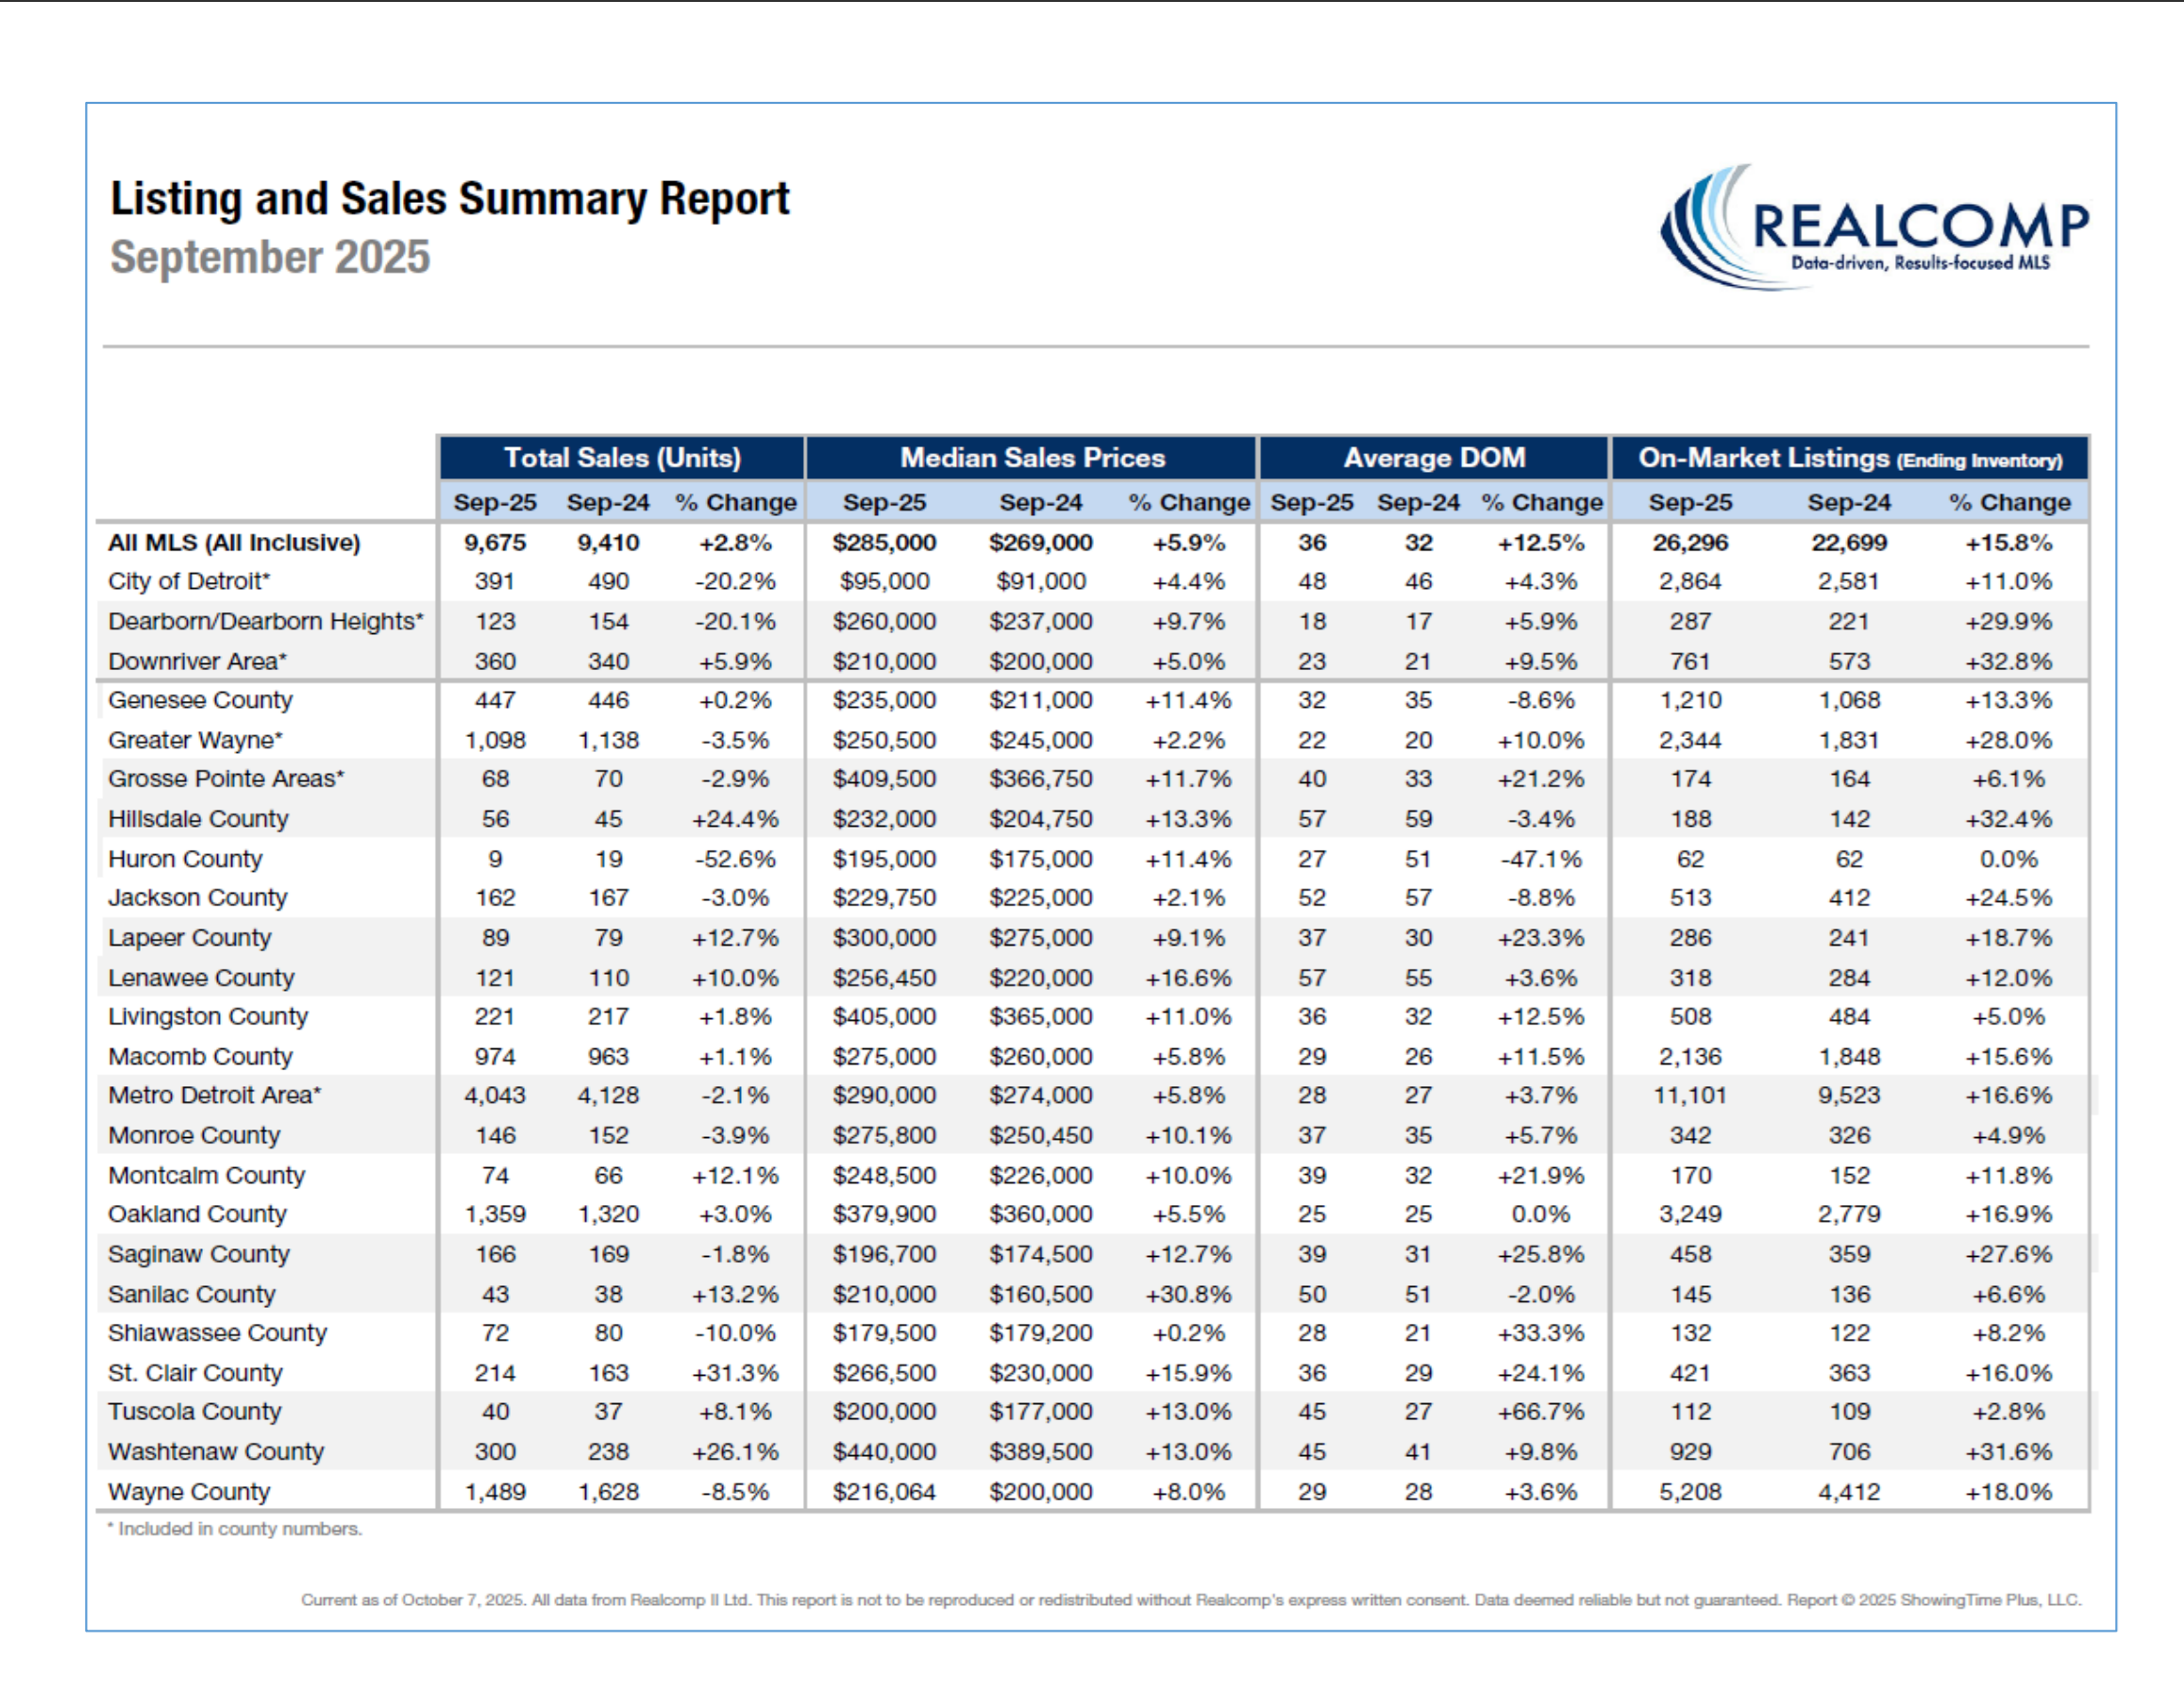
Closed Sales increased 3.0 percent for Residential homes and 1.7 percent for Condo homes. Pending Sales decreased 2.1 percent for Residential homes and 8.4 percent for Condo homes. Inventory increased 15.7 percent for Residential homes and 16.5 percent for Condo homes.
The Median Sales Price increased 5.9 percent to $285,950 for Residential homes and 7.7 percent to $280,000 for Condo homes. Days on Market increased 9.4 percent for Residential homes and 11.1 percent for Condo homes. Months-Supply of Inventory increased 11.5 percent for Residential homes and 18.5 percent for Condo homes.
September Comparisons – Res & Condo Combined - All MLS
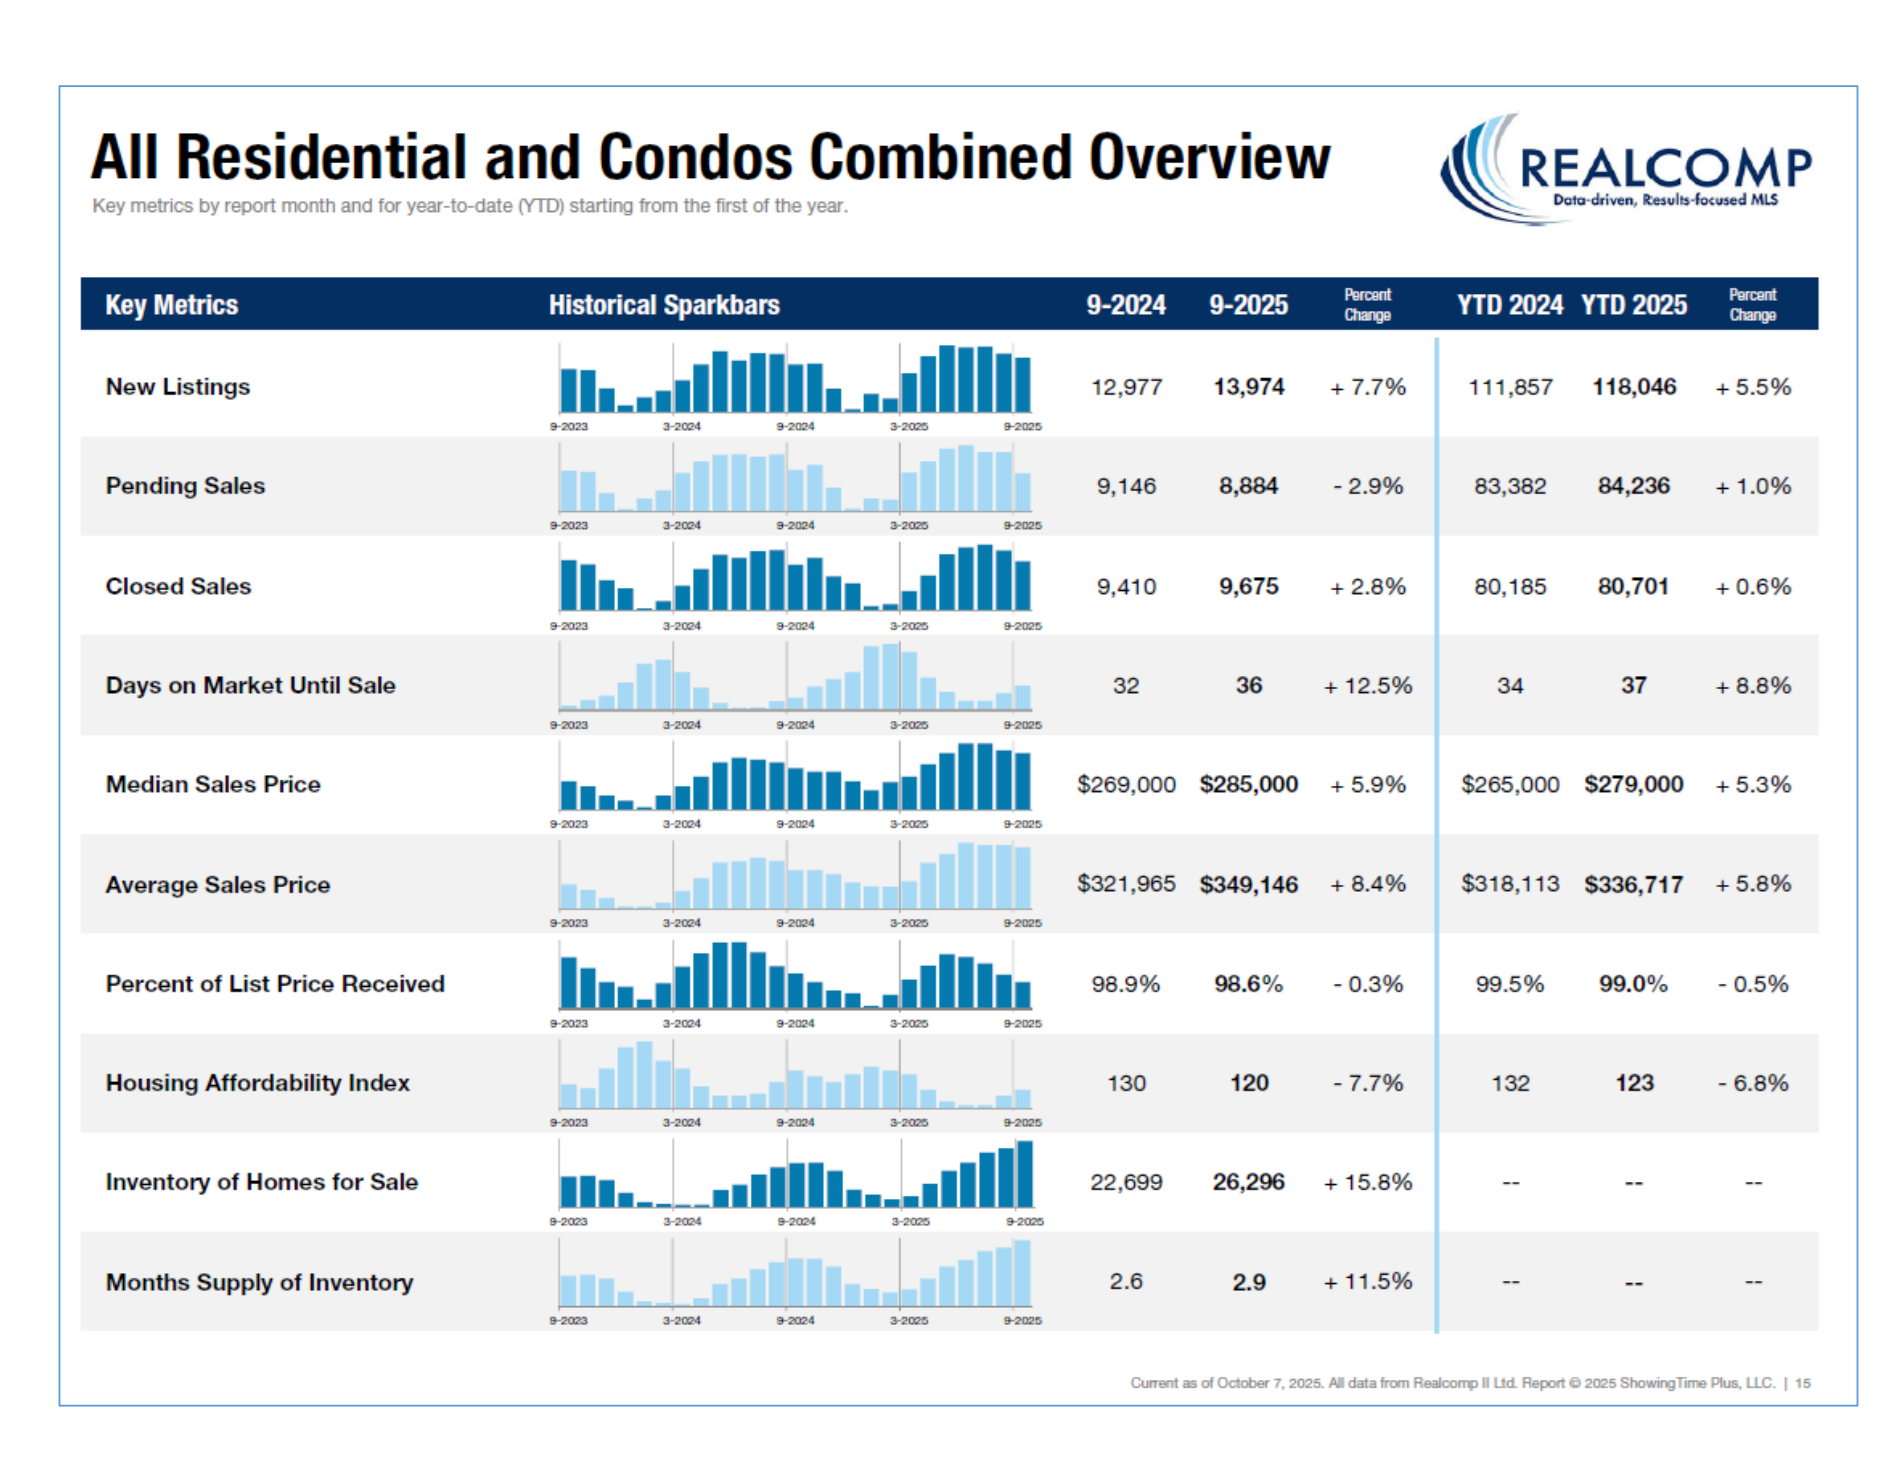
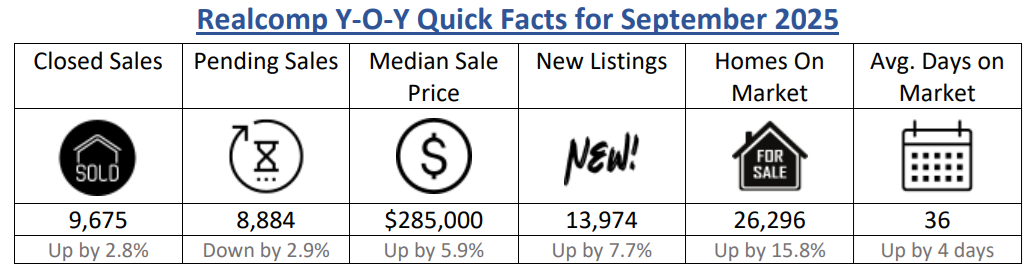
- New Listings increased by 7.7% from 12,977 to 13,974 Year-Over-Year (YOY). New Listings decreased from 14,466 Month-Over-Month (MOM), a decrease of about 3.4%.
- Pending Sales decreased by 2.9% from 9,146 to 8,884 YOY. Pending sales decreased from 9,839 MOM, a decrease of 9.71%.
- Closed Sales increased by 2.8% from 9,410 to 9,675 YOY. Closed sales decreased from 10,138 MOM, a decrease of 4.4%.
- Average Days on Market (DOM) increased by 4 days from 32 to 36 YOY. Average Days on Market increased from 34 MOM.
- Median Sale Price increased by 5.9% from $269,000 to $285,000 YOY. Median Sale price decreased from $289,000 MOM, a decrease of 1.4%.
- Percentage of Last List Price Received decreased slightly by .3% from 98.9% to 98.6% YOY. Percentage of Last List Price Received decreased by the same amount, .3%, MOM.
- Inventory of Homes for Sale increased by 15.8% from 22,699 to 26,296 YOY. + 15.8%. Inventory of Homes for Sale increased from 25,679 MOM, an increase of 2.4%.
- Month’s Supply of Inventory increased by 11.5% from 2.6 to 2.9 YOY. Month’s Supply of Inventory went unchanged MOM.
- Average Showings per Home decreased from 6.8 to 5 YOY. Average Showings decreased from 5.6 MOM, a difference of .6 showings.
- Listings that were both listed and pended in the same month were at 3,535. This represents 25.3% of the new listings for the month and 39.8% of the pended listings. Listings that were both listed and pended in the same month decreased from 4,034 MOM.
“Prospective homebuyers are continuing to enjoy more options in the marketplace across the entire MLS,” said Karen Kage, CEO, Realcomp II Ltd. “And while median sale prices have continued to increase in our market YOY, we did see a slight downtick from last month.”
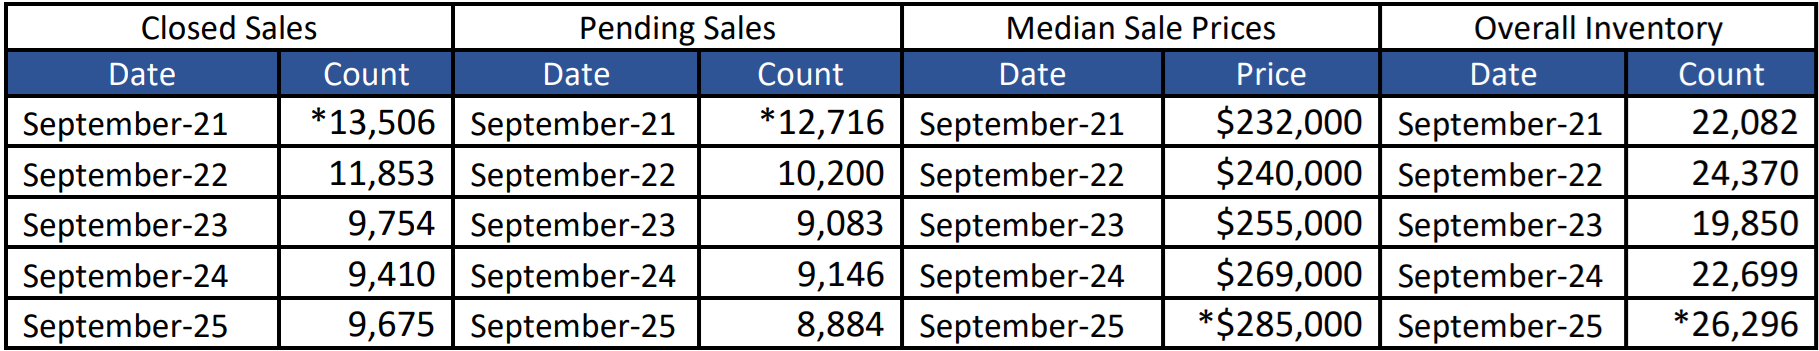
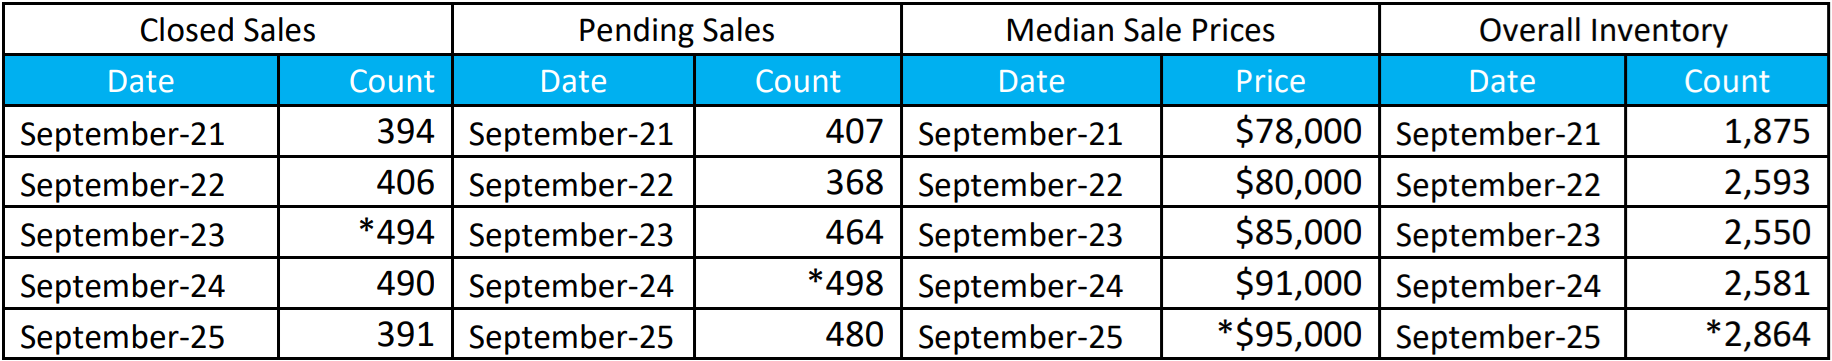
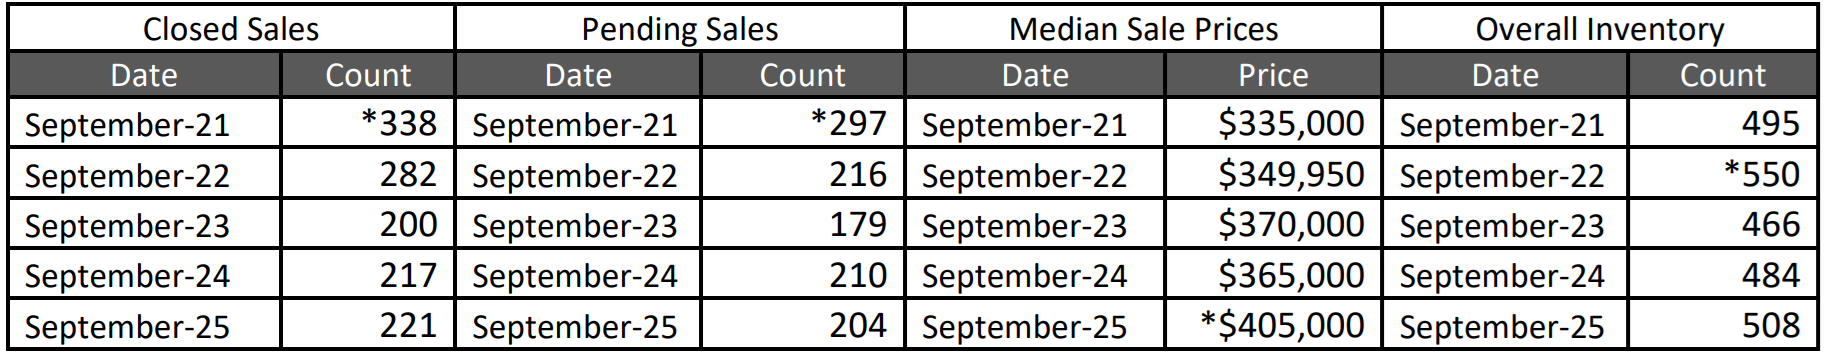
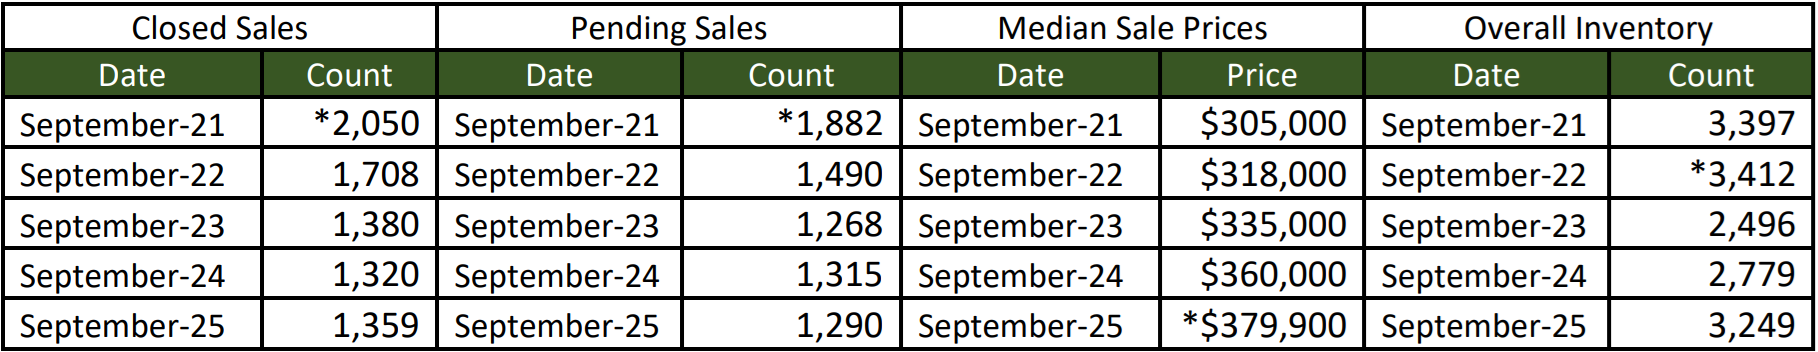
September 5-Year Perspectives -- Residential & Condos Combined -- All MLS
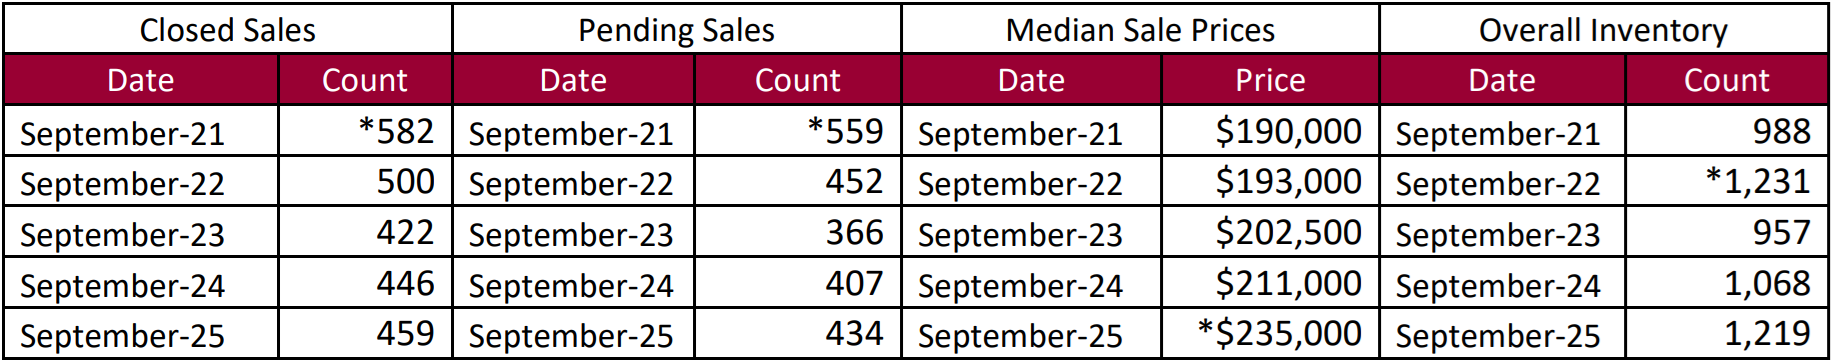
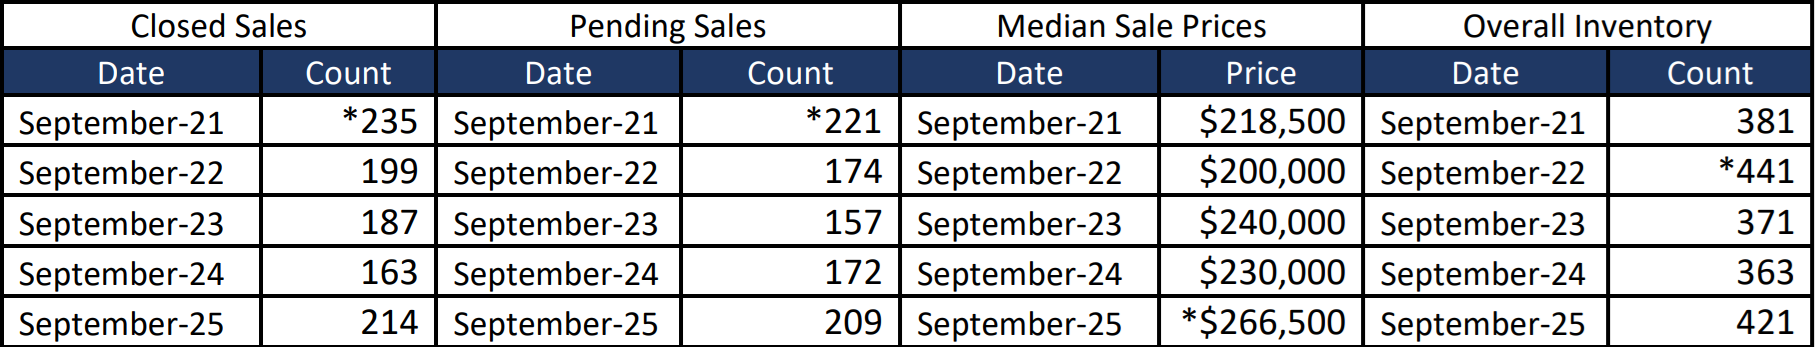
September 5-Year Perspectives -- Residential & Condos Combined – City of Detroit Numbers
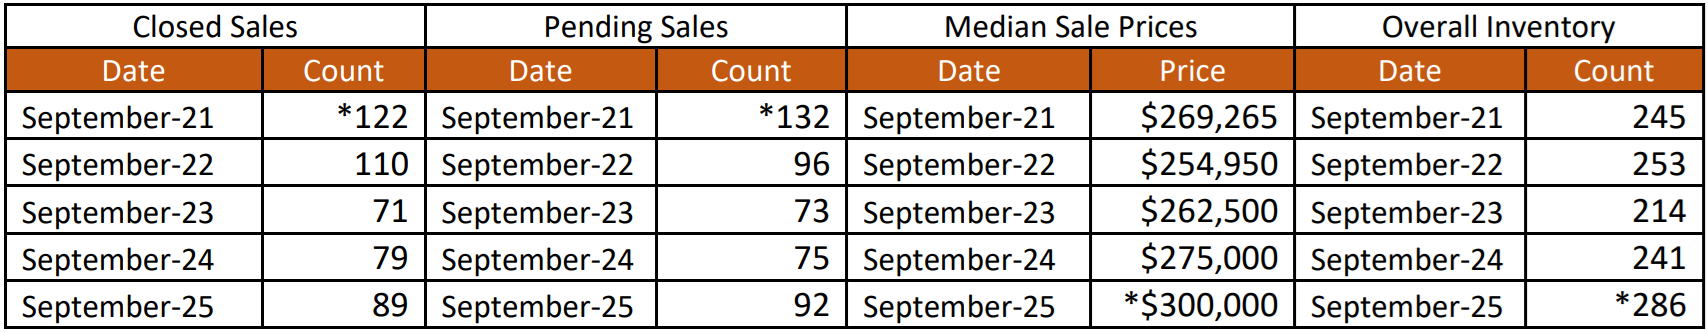
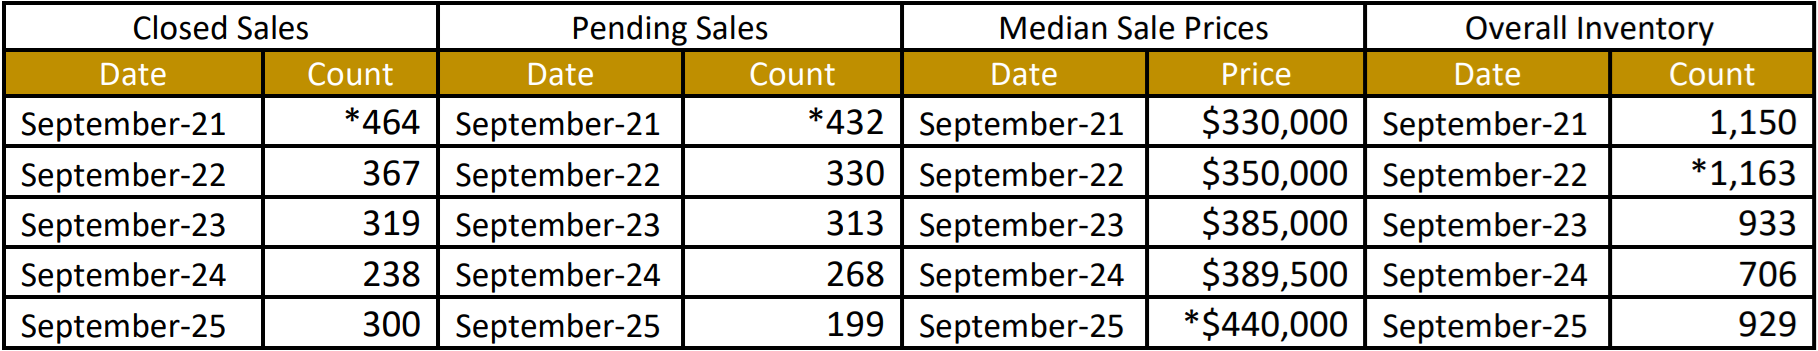
September 5-Year Perspectives -- Residential & Condos Combined -- Genessee County Numbers
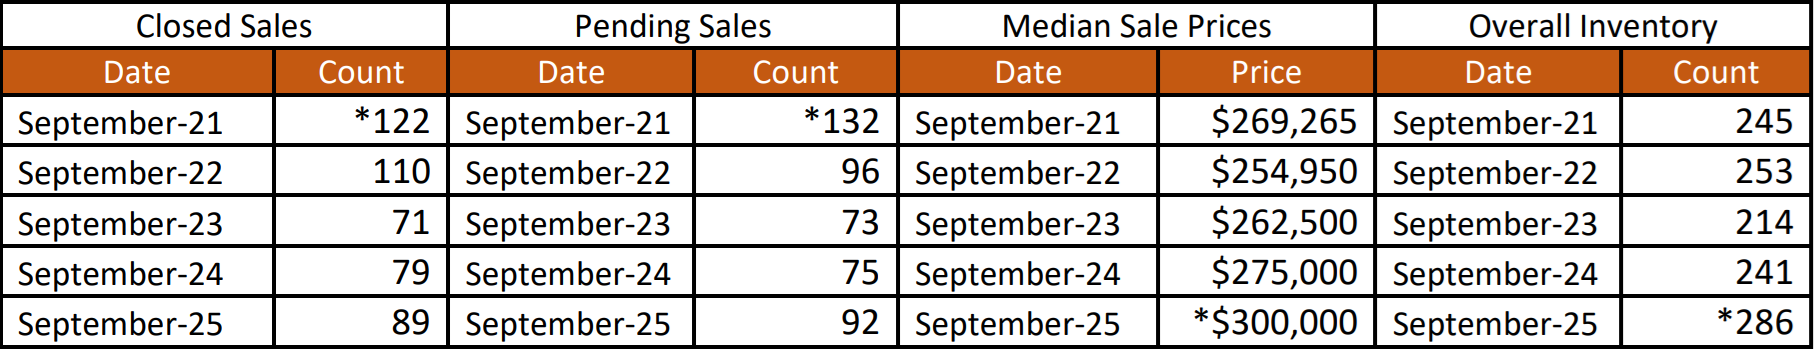
September 5-Year Perspectives -- Residential & Condos Combined -- Lapeer County Numbers
September 5-Year Perspectives -- Residential & Condos Combined -- Livingston County
September 5-Year Perspectives -- Residential & Condos Combined -- Macomb County Numbers
September 5-Year Perspectives -- Residential & Condos Combined -- Oakland County Numbers
September 5-Year Perspectives -- Residential & Condos Combined -- St. Clair County Numbers
September 5-Year Perspectives -- Residential & Condos Combined -- Washtenaw County Numbers
September 5-Year Perspectives -- Residential & Condos Combined -- Wayne County Numbers
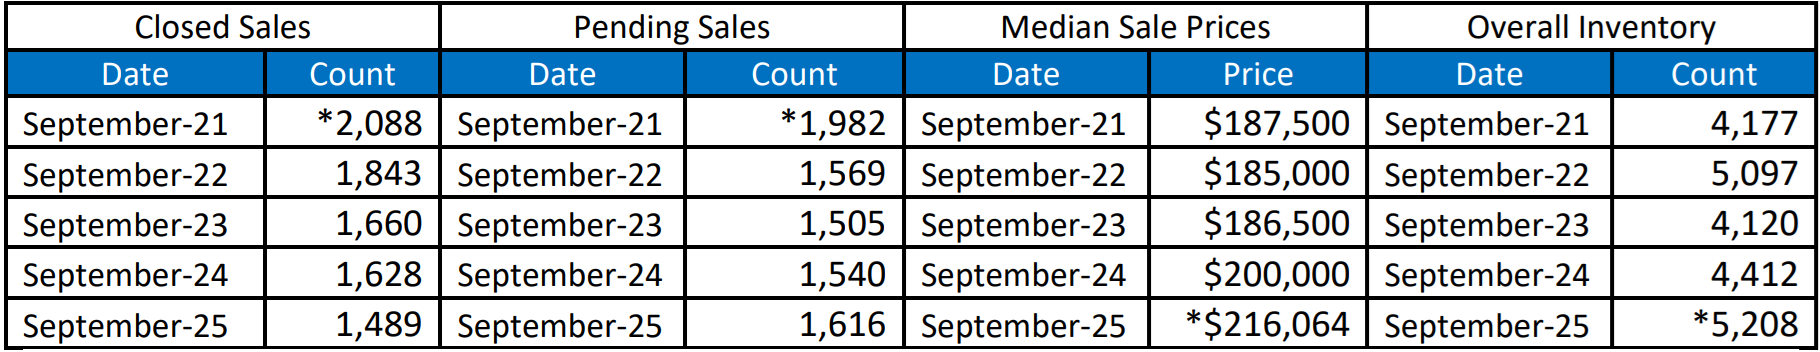
*high points noted with an asterisk.
Note: These numbers represent real estate market activity in the lower part of Michigan. Be sure to contact a REALTOR® for their expertise about local markets. Find a REALTOR® in your market at www.MoveInMichigan.com.
Realcomp Shareholder Boards & Associations of REALTORS®:
- DABOR, Andrea Kuentz, CEO, 313-278-2220
- DAR, Sharon Armour, EVP, 313-962-1313
- ETAR, Laura VanHouteghen, 810-982-6889
- GPBR, Bob Taylor, CEO, 313-882-8000
- LUTAR, 810-664-0271
- LCAR, Terri Fratarcangeli, EVP, 810-225-1100
- NOCBOR, Patricia Jacobs, EVP, 248-674-4080