

National Real Estate Commentary
Despite improving affordability conditions, U.S. existing-home sales declined 8.4% to a seasonally adjusted annual rate of 3.91 million, a 4.4% drop from one year earlier, according to the National Association of REALTORS® (NAR). The slowdown followed a 5.1% increase the previous month and modest gains throughout the fall. Sales retreated month-over-month and year-over-year in all four regions.
Nationally, the median existing-home price inched up 0.9% year-over-year to $396,800, a new high for the month, NAR reported. Home prices have continued to rise across much of the country, in part due to low supply, which remains below pre-pandemic levels. Total housing inventory stood at 1.22 million units as of the most recent reading, up 3.4% from one year earlier, representing a 3.7-month supply at the current sales pace.
February Comparisons – Res & Condo Combined - All MLS
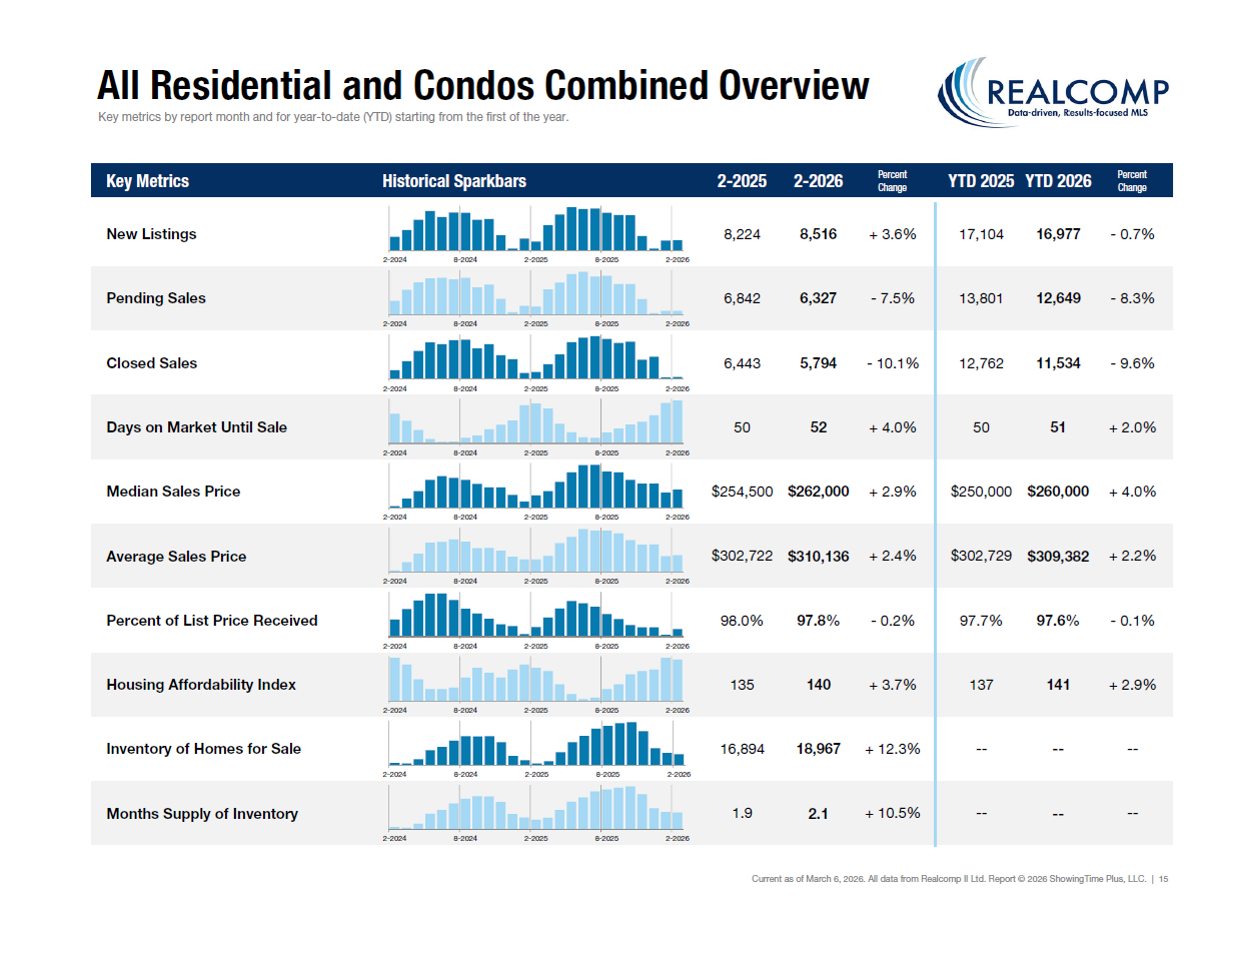
- New Listings increased by 3.6% from 8,224 to 8,516 Year-Over-Year (YOY). New Listings increased from 8,410 Month-Over-Month (MOM), an increase of 1.3%.
- Pending Sales decreased by 7.5% from 6,842 to 6,327 YOY. Pending sales increased from 5,971 MOM, an increase of 6%.
- Closed Sales decreased 10.1% from 6,443 to 5,794 YOY. Closed sales increased from 5,518 MOM, an increase of 5.0%.
- Average Days on Market (DOM) increased by 2 days from 50 to 52 YOY. Average Days on Market increased from 50 days MOM.
- Median Sale Price increased by 2.9% from $254,500 to $262,000 YOY. Median Sale price increased from $259,000 MOM, an increase of 1.2%.
- Percentage of Last List Price Received decreased slightly by 0.2% from 98% to 97.8% YOY. Percentage of Last List Price Received increased by 0.4%, MOM.
- Inventory of Homes for Sale increased by 12.3% from 16,894 to 18,967 YOY. Inventory of Homes for Sale decreased from 19,440 MOM, a decrease of 2.4%.
- Month’s Supply of Inventory increased by 10.5% from 1.9 to 2.1 YOY. Month’s Supply of Inventory decreased 4.5% from 2.2, MOM.
- Average Showings per Home decreased from 8.1 to 5.5 YOY. Average Showings increased from 5.2 MOM, a difference of 0.3 showings.
- Listings that were both listed and pended in the same month were at 2,211. This represents 26% of the new listings for the month and 34.9% of the pended listings. Listings that were both listed and pended in the same month increased from 2,132 MOM.
“It was heartening to see more homes entering the marketplace in February,” said Karen Kage, CEO, Realcomp II Ltd. “With Spring fast approaching we are hopeful it is a positive sign for good things to come.”
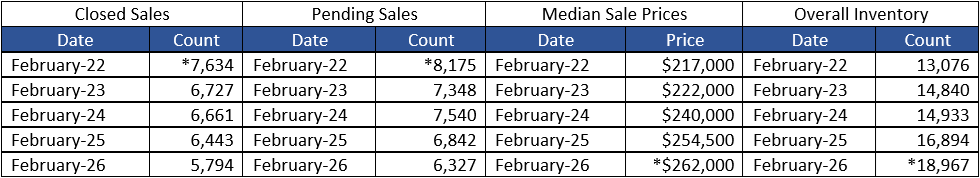
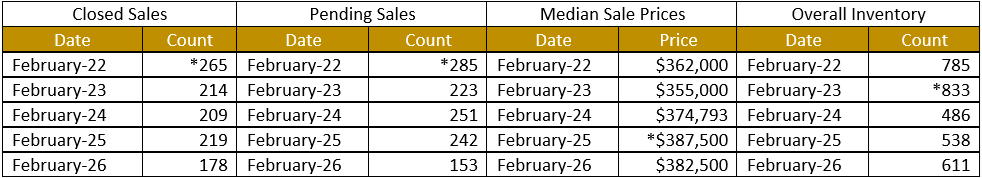
February 5-Year Perspectives -- Residential & Condos Combined -- All MLS
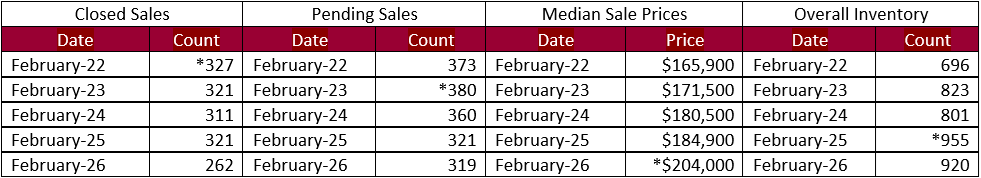
February 5-Year Perspectives -- Residential & Condos Combined – City of Detroit Numbers

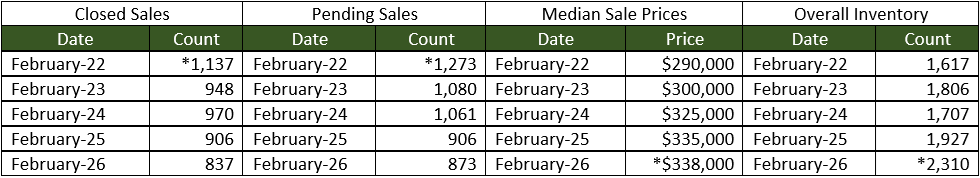
February 5-Year Perspectives -- Residential & Condos Combined -- Genessee County Numbers
February 5-Year Perspectives -- Residential & Condos Combined -- Lapeer County Numbers

February 5-Year Perspectives -- Residential & Condos Combined -- Livingston County

February 5-Year Perspectives -- Residential & Condos Combined -- Macomb County Numbers

February 5-Year Perspectives -- Residential & Condos Combined -- Oakland County Numbers
February 5-Year Perspectives -- Residential & Condos Combined -- St. Clair County Numbers

February 5-Year Perspectives -- Residential & Condos Combined -- Washtenaw County Numbers
February 5-Year Perspectives -- Residential & Condos Combined -- Wayne County Numbers
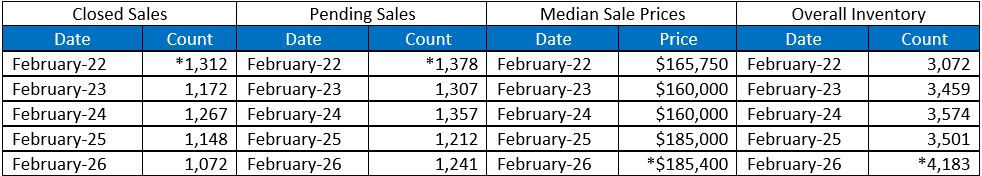
*high points noted with an asterisk.
Note: These numbers represent real estate market activity in the lower part of Michigan. Be sure to contact a REALTOR® for their expertise about local markets. Find a REALTOR® in your market at www.MoveInMichigan.com.
Realcomp Shareholder Boards & Associations of REALTORS®:
- DABOR, Chastity Townsend, AE, 313-278-2220
- DAR, Sharon Armour, EVP, 313-962-1313
- ETAR, Laura VanHouteghen, 810-982-6889
- GPBR, Bob Taylor, CEO, 313-882-8000
- LUTAR, 810-664-0271
- LCAR, Terri Fratarcangeli, EVP, 810-225-1100
- NOCBOR, Patricia Jacobs, EVP, 248-674-4080