
National Real Estate Commentary
U.S. existing home sales ticked up 0.5% from the previous month to a seasonally adjusted annual rate of 4.13 million, marking the third consecutive monthly increase, according to the National Association of REALTORS® (NAR). However, sales were down 1.0% from the same period last year. Regionally, sales rose month-over-month in the Northeast and South, were unchanged in the West, and declined in the Midwest. On a year-over-year basis, sales were flat in the Northeast and South and fell in both the Midwest and West.
The national median existing-home price continued to climb, rising 1.2% from a year ago to $409,200, according to NAR. This year-over-year increase—the 29th consecutive monthly gain—reflects ongoing tightness in housing supply. At the end of November, there were 1.43 million units for sale, down 5.9% from the previous month but up 7.5% from the same time last year, representing a 4.2-month supply at the current sales pace.
December-Local Activity
Closed Sales increased 0.3 percent for Residential homes but decreased 2.5 percent for Condo homes. Pending Sales decreased 6.9 percent for Residential homes and 10.3 percent for Condo homes. Inventory increased 8.8 percent for Residential homes and 19.7 percent for Condo homes.
The Median Sales Price increased 4.7 percent to $270,000 for Residential homes and 11.4 percent to $273,000 for Condo homes. Days on Market increased 7.5 percent for Residential homes and 4.5 percent for Condo homes. Months Supply of Inventory increased 10.0 percent for Residential homes and 17.4 percent for Condo homes.
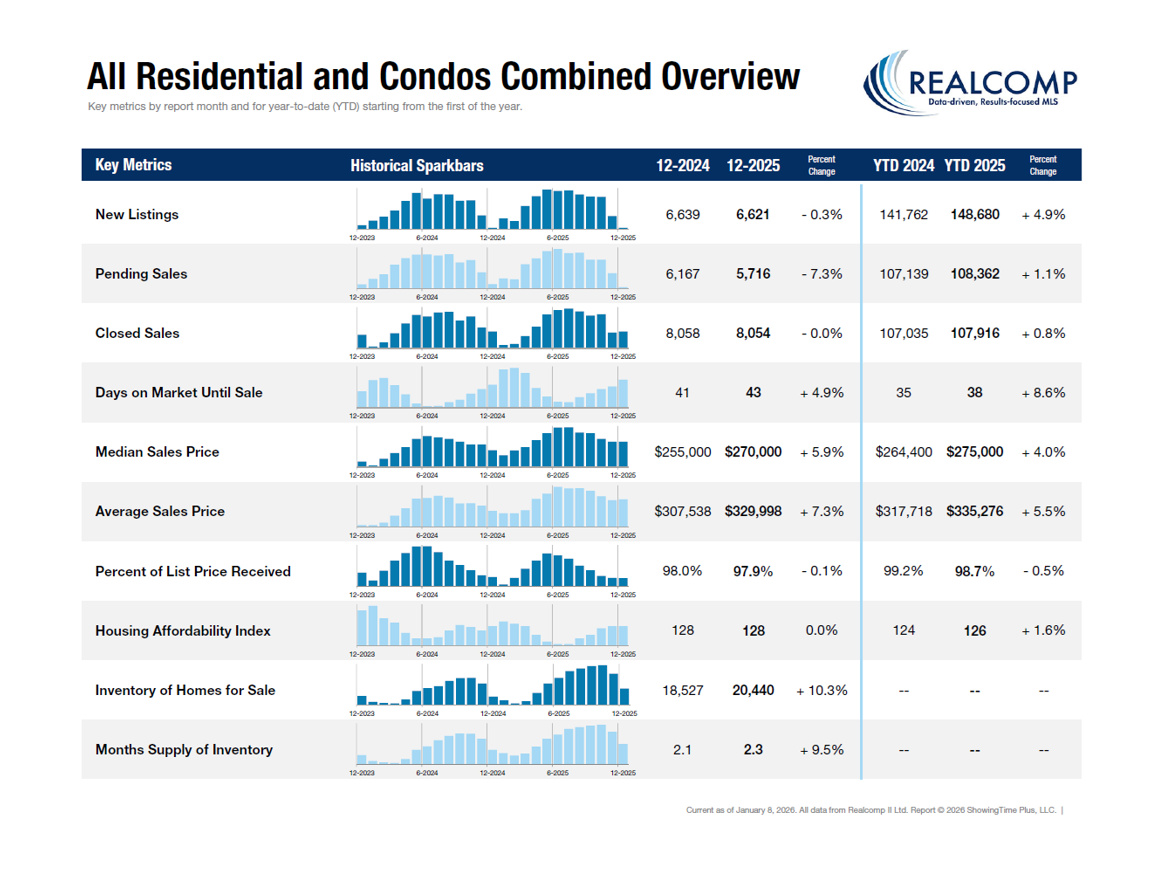
December Comparisons – Res & Condo Combined - All MLS
- New Listings decreased by 0.3% from 6,639 to 6,621Year-Over-Year (YOY). New Listings decreased from 9,368 Month-Over-Month (MOM), a decrease of 29.3%.
- Pending Sales decreased by 7.3% from 6,167 to 5,716 YOY. Pending sales decreased from 7,184 MOM, a decrease of 20.4%.
- Closed Sales remained steady from 8,058 to 8,054 YOY. Closed sales decreased from 7,656 MOM, a decrease of 5.2%.
- Average Days on Market (DOM) increased by 2 days from 41 to 43 YOY. Average Days on Market increased from 40 days MOM.
- Median Sale Price increased by 5.9% from $255,000 to $270,000 YOY. Median Sale price decreased from $274,700 MOM, a decrease of 1.7%.
- Percentage of Last List Price Received decreased slightly by .1% from 98.0% to 97.9% YOY. Percentage of Last List Price Received decreased by 0.1%, MOM.
- Inventory of Homes for Sale increased by 10.3% from 18,527 to 20,440 YOY. Inventory of Homes for Sale decreased from 24,529 MOM, a decrease of 16.7%.
- Month’s Supply of Inventory increased by 9.5% from 2.1 to 2.3 YOY. Month’s Supply of Inventory decreased 14.8% from 2.7, MOM.
- Average Showings per Home decreased from 5.5 to 3.6 YOY. Average Showings decreased from 4.2 MOM, a difference of .6 showings.
- Listings that were both listed and pended in the same month were at 1,600. This represents 24.2% of the new listings for the month and 28.0% of the pended listings. Listings that were both listed and pended in the same month decreased from 2,214 MOM.
“December performed as it does in most years with the holiday season affecting sales activity to a slight degree,” said Karen Kage, CEO, Realcomp II Ltd. “As we begin a new year, inventory levels are strong with median sales prices steady. We are looking forward to the year ahead and what the marketplace will bring.”
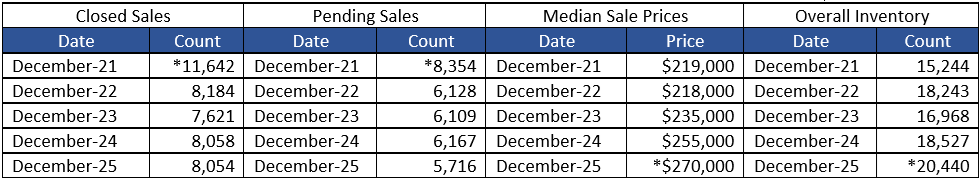
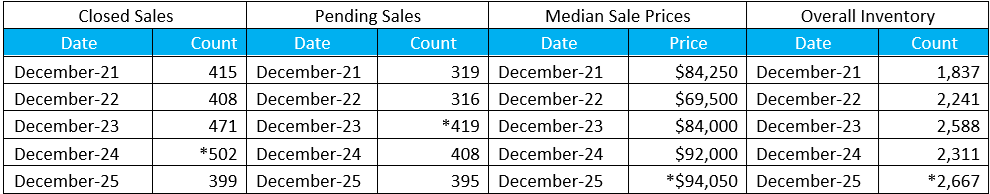
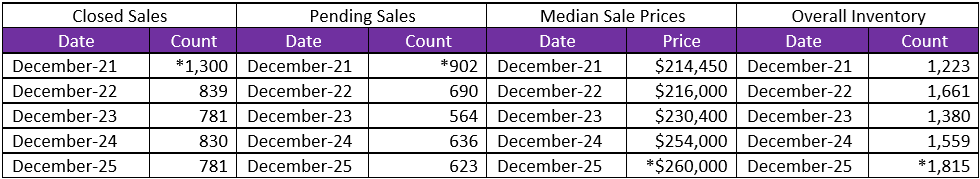
December 5-Year Perspectives -- Residential & Condos Combined -- All MLS
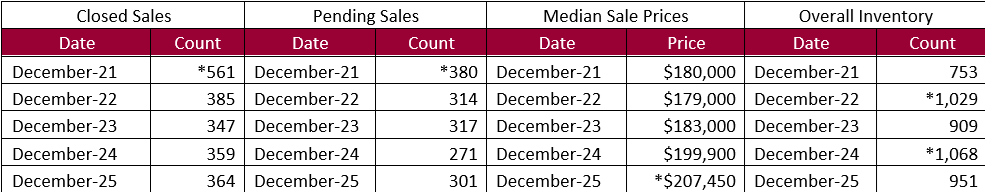
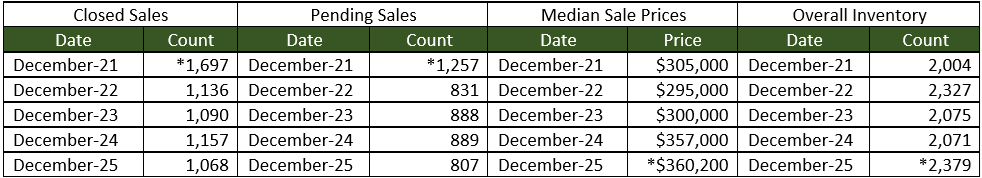
December 5-Year Perspectives -- Residential & Condos Combined – City of Detroit Numbers
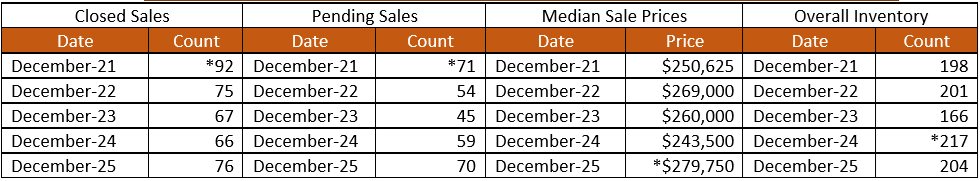
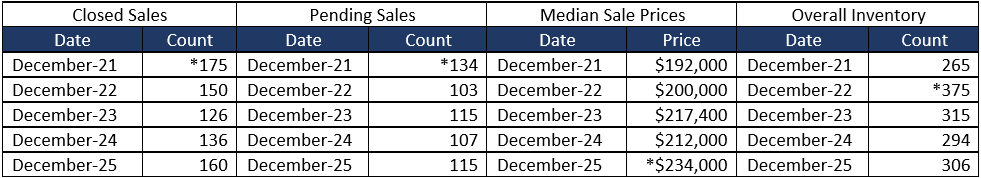
December 5-Year Perspectives -- Residential & Condos Combined -- Genessee County Numbers
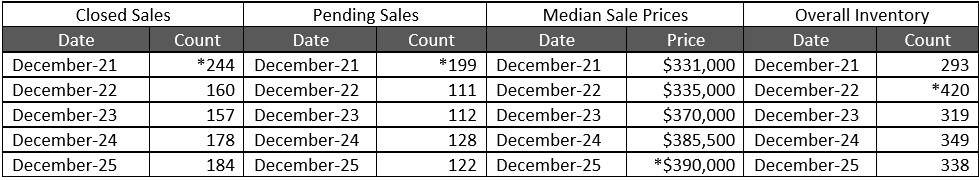
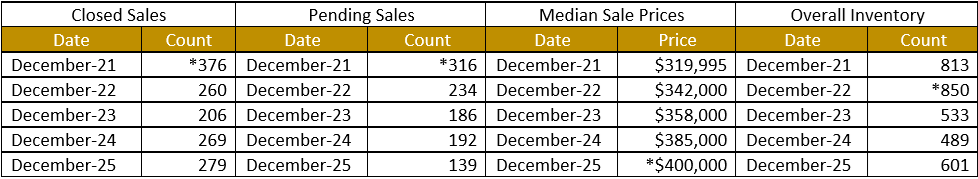
December 5-Year Perspectives -- Residential & Condos Combined -- Lapeer County Numbers
December 5-Year Perspectives -- Residential & Condos Combined -- Livingston County
December 5-Year Perspectives -- Residential & Condos Combined -- Macomb County Numbers
December 5-Year Perspectives -- Residential & Condos Combined -- Oakland County Numbers
December 5-Year Perspectives -- Residential & Condos Combined -- St. Clair County Numbers
December 5-Year Perspectives -- Residential & Condos Combined -- Washtenaw County Numbers
December 5-Year Perspectives -- Residential & Condos Combined -- Wayne County Numbers
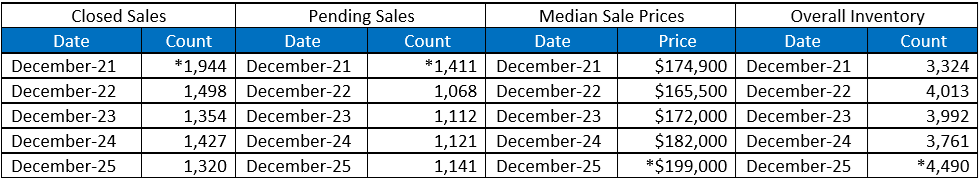
*high points noted with an asterisk.
Note: These numbers represent real estate market activity in the lower part of Michigan. Be sure to contact a REALTOR® for their expertise about local markets. Find a REALTOR® in your market at www.MoveInMichigan.com.
Realcomp Shareholder Boards & Associations of REALTORS®:
- DABOR, Andrea Kuentz, CEO, 313-278-2220
- DAR, Sharon Armour, EVP, 313-962-1313
- ETAR, Laura VanHouteghen, 810-982-6889
- GPBR, Bob Taylor, CEO, 313-882-8000
- LUTAR, 810-664-0271
- LCAR, Terri Fratarcangeli, EVP, 810-225-1100
- NOCBOR, Patricia Jacobs, EVP, 248-674-4080