
National Real Estate Commentary
U.S. existing-home sales climbed 5.1% month-over-month and 1.4% year-over-year to a seasonally adjusted annual rate of 4.35 million units, the [+ 10.2%] strongest pace in nearly three years, according to the National Association of REALTORS® (NAR). Lower mortgage rates and slower home price growth helped spur buyer activity, and sales increased month-over-month in every region. On an annual basis, sales rose in the South, held steady in the West and Midwest, and declined in the Northeast.
Nationally, there were 1.18 million homes for sale heading into January, an 18.1% decline from the previous month but 3.5% higher compared to the same period last year, representing a 3.3-month supply at the current sales pace, according to NAR. Meanwhile, the median existing home price rose 0.4% from a year ago to $405,400, reflecting a continued moderation in national price growth.
January-Local Activity
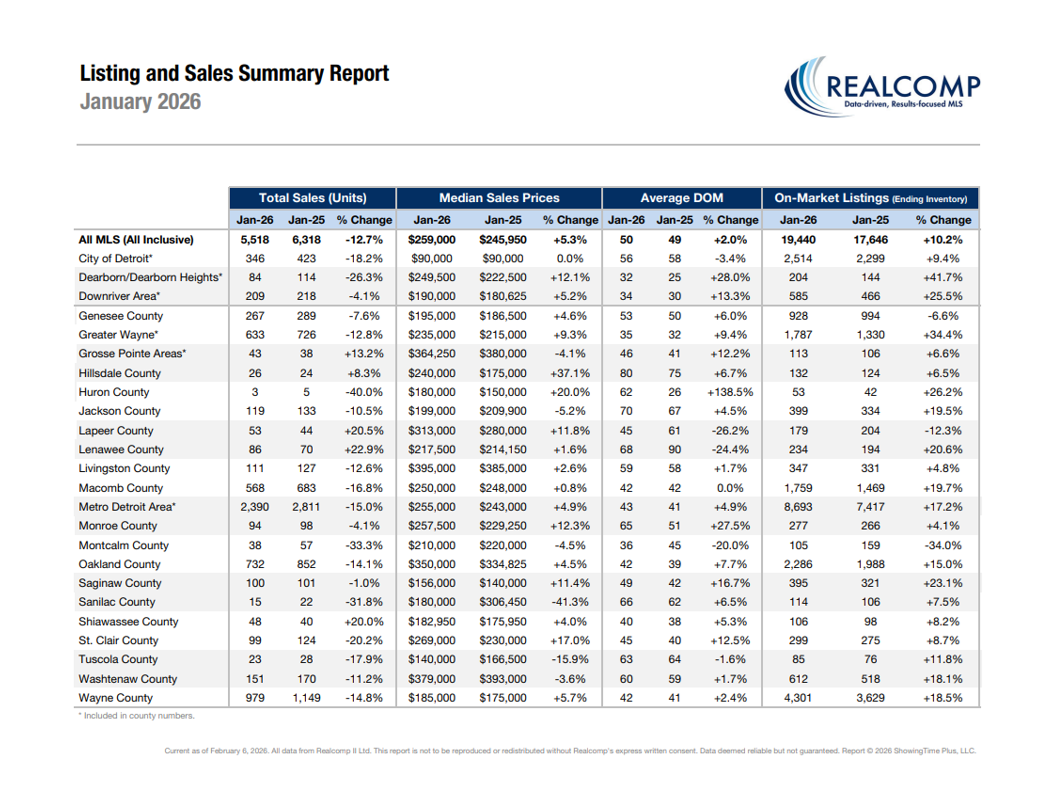
Closed Sales decreased 12.8 percent for Residential homes and 12.0 percent for Condo homes. Pending Sales decreased 14.9 percent for Residential homes and 9.5 percent for Condo homes. Inventory increased 8.3 percent for Residential homes and 21.0 percent for Condo homes.
The Median Sales Price increased 5.1 percent to $257,500 for Residential homes and 4.0 percent to $265,000 for Condo homes. Days on Market increased 2.0 percent for Residential homes and 6.0 percent for Condo homes. Months Supply of Inventory increased 10.5 percent for Residential homes and 21.7 percent for Condo homes.
January Comparisons – Res & Condo Combined - All MLS
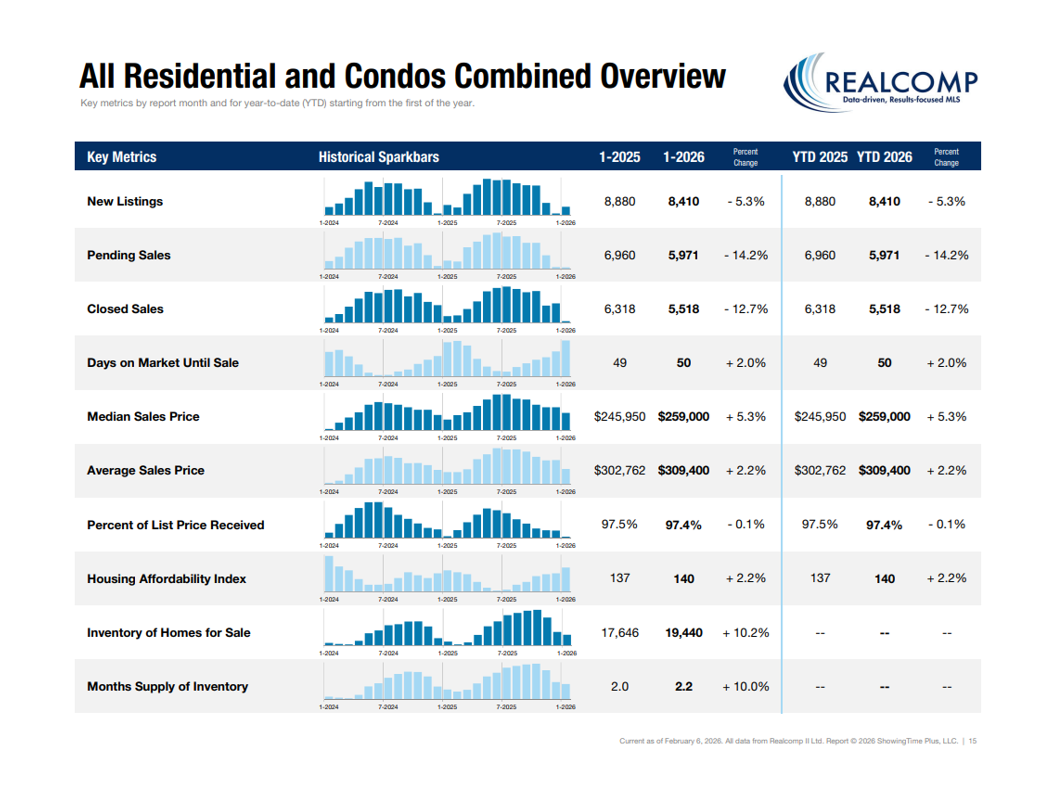
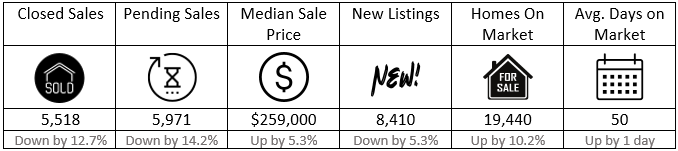
- New Listings decreased by 5.3% from 8,880 to 8,410 Year-Over-Year (YOY). New Listings increased from 6,621 Month-Over-Month (MOM), an increase of 27% showing that sellers are ready to put their homes on the market after the holidays
- Pending Sales decreased by 14.2% from 6,960 to 5,971 YOY. Pending sales increased from 5,716 MOM, an increase of 4.5%.
- Closed Sales decreased 12.7% from 6,318 to 5,518 YOY.
- Average Days on Market (DOM) increased by 1 day from 49 to 50 YOY. Average Days on Market increased from 43 days MOM.
- Median Sale Price increased by 5.3% from $245,950 to $259,000 YOY. Median Sale price decreased from $270,000 MOM, a decrease of 4.1%.
- Percentage of Last List Price Received decreased slightly by 0.1% from 97.5% to 97.4% YOY. Percentage of Last List Price Received decreased by 0.5%, MOM.
- Inventory of Homes for Sale increased by 10.2% from 17,646 to 19,440 YOY. Inventory of Homes for Sale decreased from 20,440 MOM, a decrease of 4.9%.
- Month’s Supply of Inventory increased by 10% from 2.0 to 2.2 YOY. Month’s Supply of Inventory decreased 4.3% from 2.3, MOM.
- Average Showings per Home decreased from 7.9 to 5.2 YOY. Average Showings decreased from 3.6 MOM, a difference of 1.6 showings.
- Listings that were both listed and pended in the same month were at 2,132. This represents 25.4% of the new listings for the month and 35.7% of the pended listings.
“Activity in the marketplace for the month was encouraging, said Karen Kage, CEO, Realcomp II Ltd. “With 25% of the listings put on the market in January also placed under contract in January.”
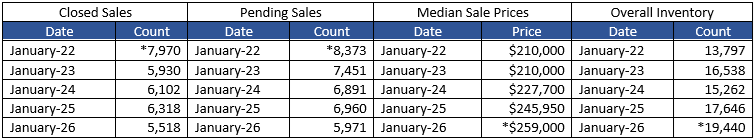
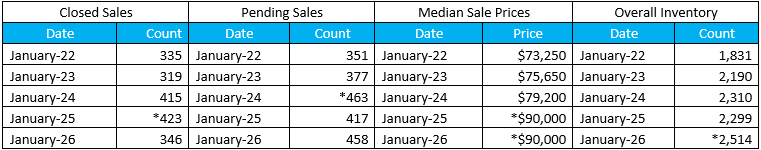
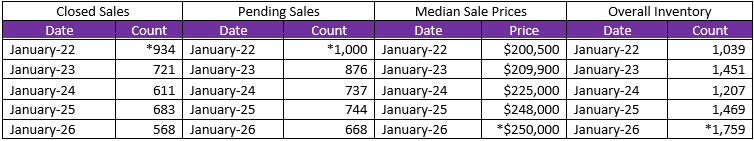
January 5-Year Perspectives -- Residential & Condos Combined -- All MLS
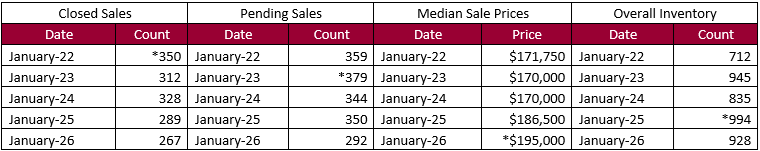
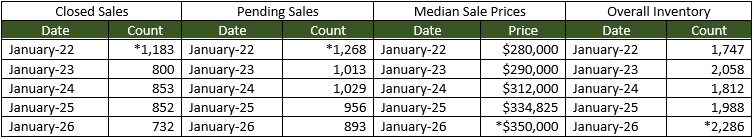
January 5-Year Perspectives -- Residential & Condos Combined – City of Detroit Numbers
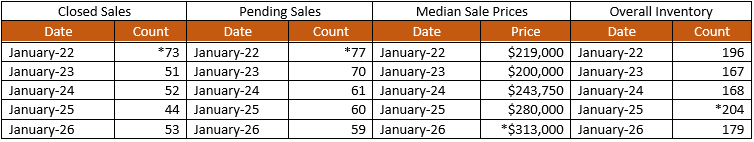
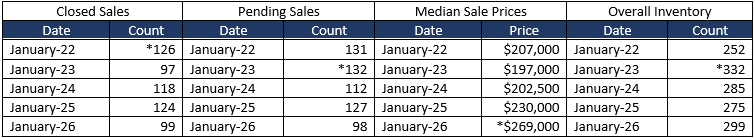
January 5-Year Perspectives -- Residential & Condos Combined -- Genessee County Numbers
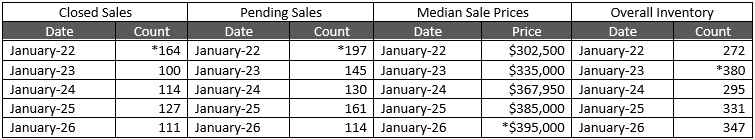
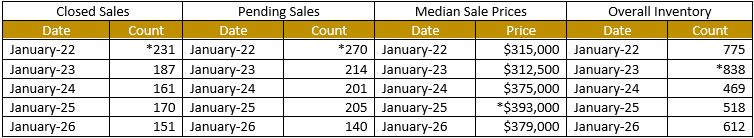
January 5-Year Perspectives -- Residential & Condos Combined -- Lapeer County Numbers
January 5-Year Perspectives -- Residential & Condos Combined -- Livingston County
January 5-Year Perspectives -- Residential & Condos Combined -- Macomb County Numbers
January 5-Year Perspectives -- Residential & Condos Combined -- Oakland County Numbers
January 5-Year Perspectives -- Residential & Condos Combined -- St. Clair County Numbers
January 5-Year Perspectives -- Residential & Condos Combined -- Washtenaw County Numbers
January 5-Year Perspectives -- Residential & Condos Combined -- Wayne County Numbers
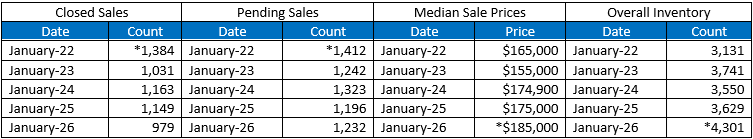
*high points noted with an asterisk.
Note: These numbers represent real estate market activity in the lower part of Michigan. Be sure to contact a REALTOR® for their expertise about local markets. Find a REALTOR® in your market at www.MoveInMichigan.com.
Realcomp Shareholder Boards & Associations of REALTORS®:
- DABOR, Andrea Kuentz, CEO, 313-278-2220
- DAR, Sharon Armour, EVP, 313-962-1313
- ETAR, Laura VanHouteghen, 810-982-6889
- GPBR, Bob Taylor, CEO, 313-882-8000
- LUTAR, 810-664-0271
- LCAR, Terri Fratarcangeli, EVP, 810-225-1100
- NOCBOR, Patricia Jacobs, EVP, 248-674-4080