
National Real Estate Commentary
U.S. existing-home sales edged up 0.8% month-over-month to a seasonally adjusted annual rate of 4.03 million units, exceeding economists’ expectations, although sales were down 0.7% year-over-year, according to the National Association of REALTORS® (NAR). On a monthly basis, sales increased in the Midwest, Northeast, and South but decreased in the West.
Heading into June, there were 1.54 million units for sale across the country, a 6.2% increase from the previous month and a 20.3% improvement over the same period last year, representing a 4.6-month supply at the current sales pace, according to NAR. Despite the additional supply, home prices have continued to rise nationwide, albeit at a slower pace than during the pandemic, climbing 1.3% year-over-year to $422,800 as of last measure.
June-Local Activity
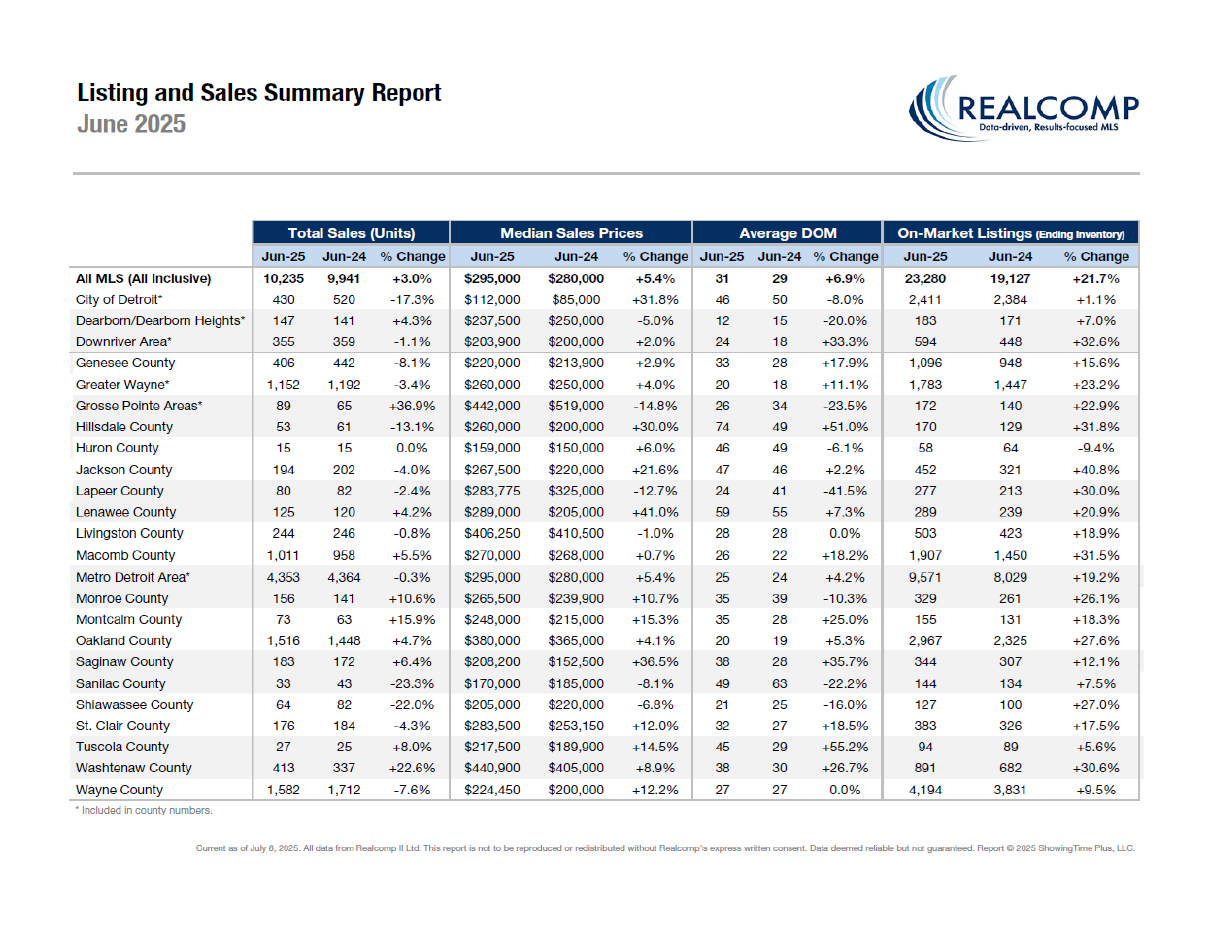
Closed Sales increased 3.0 percent for Residential homes and 2.4 percent for Condo homes. Pending Sales decreased 0.3 percent for Residential homes but increased 4.9 percent for Condo homes. Inventory increased 21.0 percent for Residential homes and 26.5 percent for Condo homes.
The Median Sales Price increased 7.1 percent to $299,900 for Residential homes but decreased 1.4 percent to $276,000 for Condo homes. Days on Market increased 7.1 percent for Residential homes but decreased 2.8 percent for Condo homes. Months-Supply of Inventory increased 18.2 percent for Residential homes and 26.1 percent for Condo homes.
“Sales increased as we saw more homes on the market than in the previous five years in June with over 23,000 homes available for home buyers,” said Karen S. Kage, Realcomp CEO. “At the same time, home sellers experienced another median sales price jump and a new all-time high of $295,000. The market is healthy as the summer season continues.”
June Y-O-Y Comparison -- Residential & Condos Combined -- All MLS
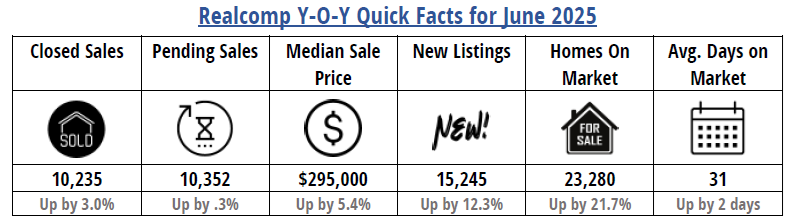
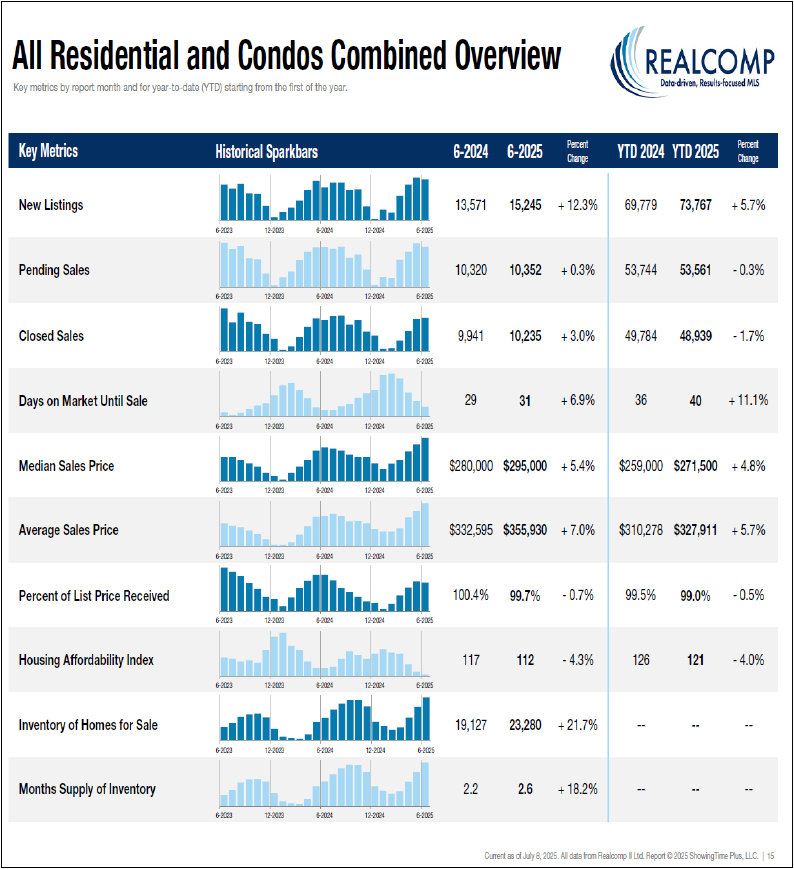
- New Listings increased by 12.3% from 13,571 to 15,245 Year-Over-Year (YOY). New Listings decreased .02% from 15,499 Month-Over-Month (MOM).
- Pending Sales increased by .3% from 10,320 to 10,352 YOY. Pending Sales increased from 10,166 MOM, an increase of .02%
- Closed Sales increased by 3.0% from 9,941 to 10,235 YOY. Closed Sales increased from 9,713 MOM, an increase of .05%.
- Average Days on Market (DOM) increased by 2 days from 29 to 31 YOY. Average Days on Market decreased from 34 days MOM.
- Median Sale Price increased by 5.4% from $280,000 to $295,000 YOY. Median Sale Price increased from $285,000 MOM, and increase of .04%.
- Percentage of Last List Price Received decreased slightly by .7% from 100.4% to 99.7% YOY. Percentage of Last List Price Received decreased from 99.8% MOM.
- Inventory of Homes for Sale increased by 21.7% from 19,127 to 23,280 YOY. Inventory of Homes for Sale increased from 21,837 MOM.
- Month’s Supply of Inventory increased by 18.2% from 2.2 to 2.6 YOY. Month’s Supply of Inventory increased from 2.5 MOM.
- Average Showings per Home decreased from 9.1 to 5.9 YOY. Average Showings decreased from 6.9 MOM.
- Listings that were both listed and pended in the same month were at 4,884. This represents 32.0% of the new listings for the month and 47.2% of the pended listings. Listings that were both listed and pended in the same month increased from 4,979 MOM.
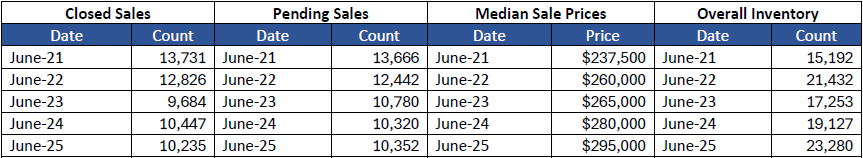
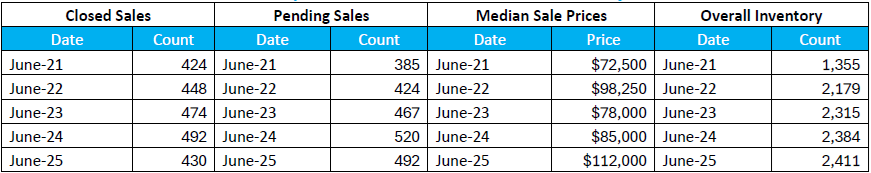
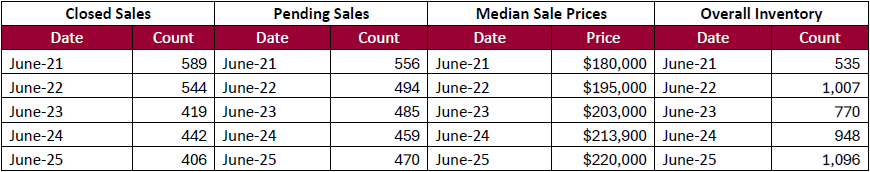
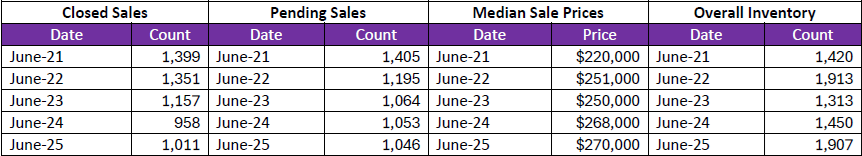
June 5-Year Perspectives -- Residential & Condos Combined -- All MLS
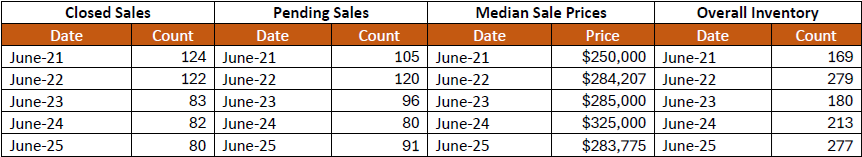
June 5-Year Perspectives -- Residential & Condos Combined – City of Detroit Numbers
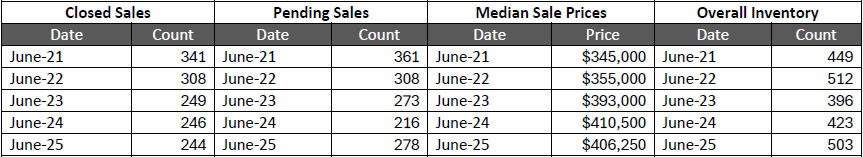
June 5-Year Perspectives -- Residential & Condos Combined -- Genessee County Numbers
June 5-Year Perspectives -- Residential & Condos Combined -- Lapeer County Numbers
June 5-Year Perspectives -- Residential & Condos Combined -- Livingston County
June 5-Year Perspectives -- Residential & Condos Combined -- Macomb County Numbers
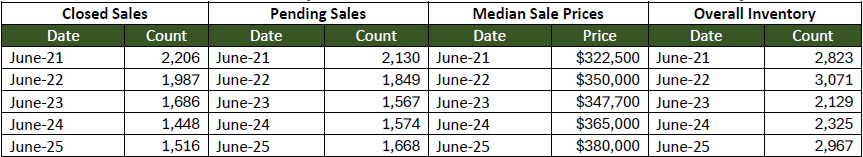
June 5-Year Perspectives -- Residential & Condos Combined -- Oakland County Numbers
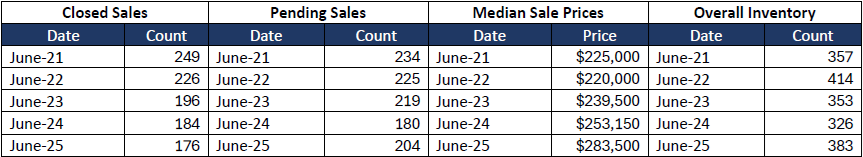
June 5-Year Perspectives -- Residential & Condos Combined -- St. Clair County Numbers
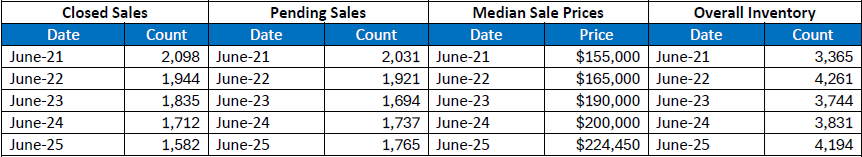
June 5-Year Perspectives -- Residential & Condos Combined -- Wayne County Numbers
*high points noted with an asterisk.
Note: These numbers represent real estate market activity in the lower part of Michigan. Be sure to contact a REALTOR® for their expertise about local markets. Find a REALTOR® in your market at www.MoveInMichigan.com.
Realcomp Shareholder Boards & Associations of REALTORS®:
- DABOR, Andrea Kuentz, CEO, 313-278-2220
- DAR, Sharon Armour, EVP, 313-962-1313
- ETAR, Laura VanHouteghen, 810-982-6889
- GPBR, Bob Taylor, CEO, 313-882-8000
- LUTAR, 810-664-0271
- LCAR, Terri Fratarcangeli, EVP, 810-225-1100
- NOCBOR, Patricia Jacobs, EVP, 248-674-4080