National Real Estate Commentary
U.S. existing-home sales rose 1.7% month-over-month to a seasonally adjusted annual rate of 4.09 million, as lower mortgage rates helped boost buyer activity, according to the National Association of REALTORS® (NAR). Monthly sales increased in the Midwest, South, and West but decreased in the Northeast. Sales increased year-over-year in the South, but fell in the Northeast, Midwest, and West.
Data from NAR show that inventory continued to grow nationwide, ticking up 2.4% month-over-month and 4.9% year-over-year to 1.29 million units heading into March, representing a 3.8-month supply at the current sales pace. Meanwhile, home prices increased for the 32nd consecutive month, climbing 0.3% year-over-year to $398,000.
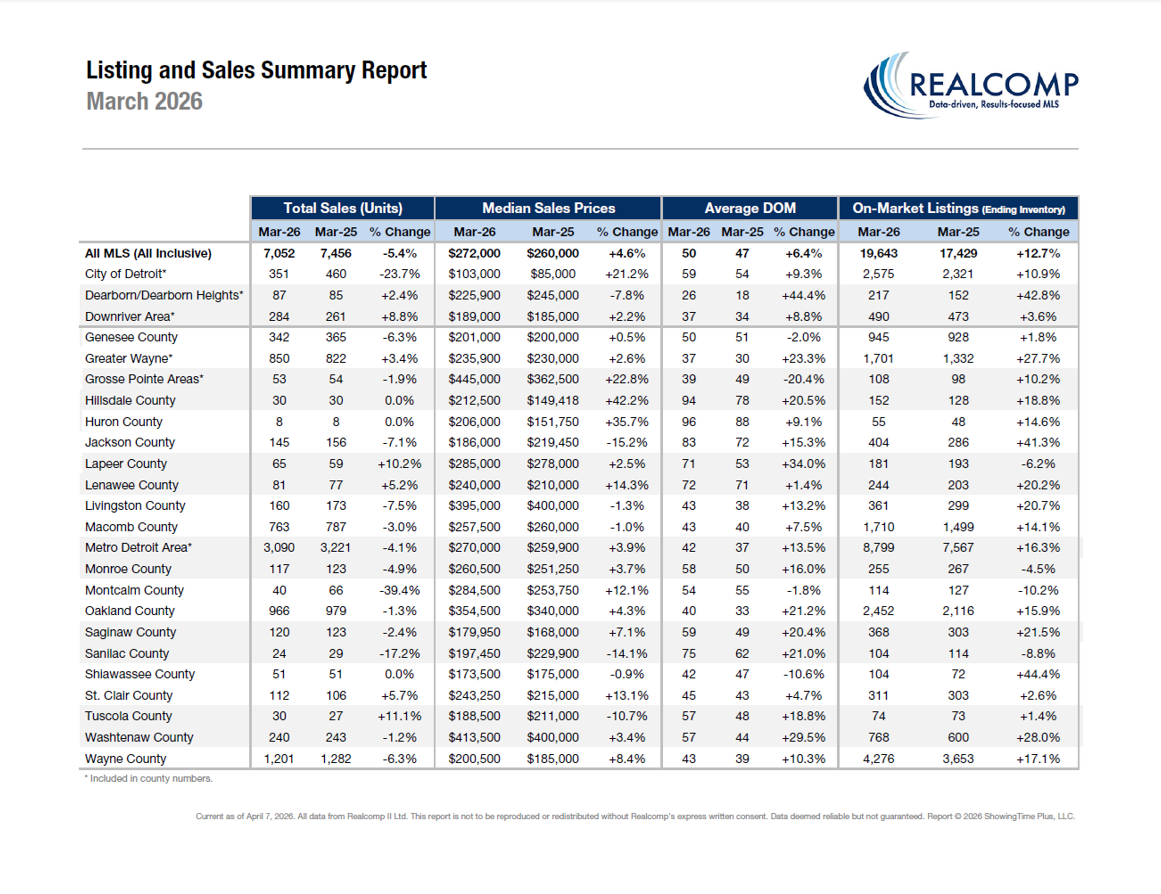
March Comparisons – Res & Condo Combined - All MLS
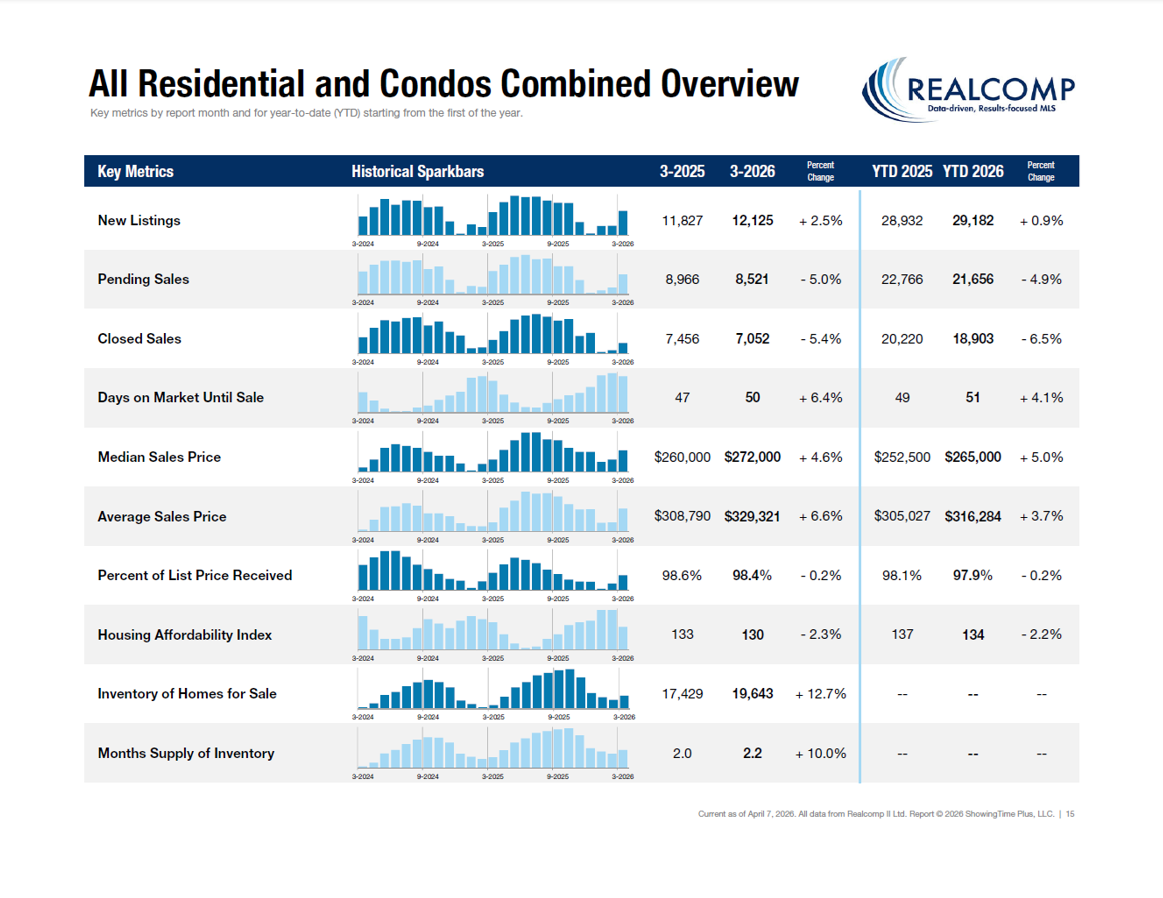
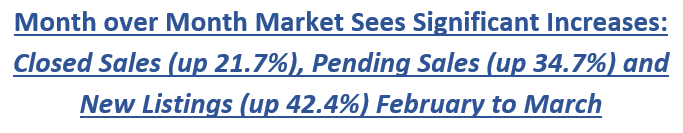
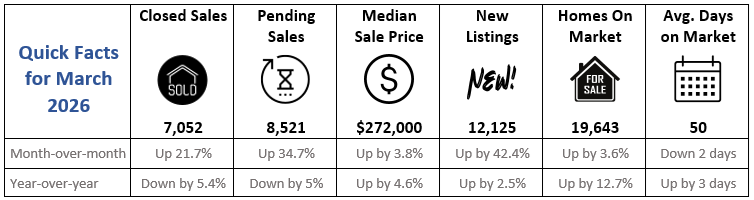
- New Listings increased by 2.5% from 11,827 to 12,125 Year-Over-Year (YOY). New Listings increased from 8,516 Month-Over-Month (MOM), an increase of 42.4%.
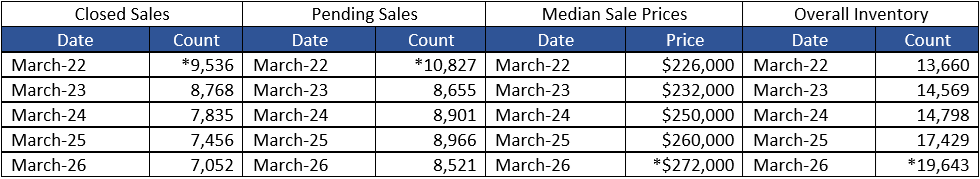
- Pending Sales decreased by 5% from 8,966 to 8,521 YOY. Pending sales increased from 6,327 MOM, an increase of 34.7%.
- Closed Sales decreased 5.4% from 7,456 to 7,052 YOY. Closed sales increased from 5,794 MOM, an increase of 21.7%.
- Average Days on Market (DOM) increased by 3 days from 47 to 50 YOY. Average Days on Market decreased from 52 days MOM.
- Median Sale Price increased by 4.6% from $260,000 to $272,000 YOY. Median Sale price increased from $262,000 MOM, an increase of 3.8%.
- Percentage of Last List Price Received decreased slightly by 0.2% from 98.7% to 98.5% YOY. Percentage of Last List Price Received increased by 0.7%, MOM.
- Inventory of Homes for Sale increased by 12.7% from 17,429 to 19,643 YOY. Inventory of Homes for Sale increased from 18,967 MOM, an increase of 3.6%.
- Month’s Supply of Inventory increased by 10% from 2 to 2.2 YOY. Month’s Supply of Inventory increased 4.8% from 2.1, MOM.
- Average Showings per Home decreased from 7.5 to 6.6 YOY. Average Showings increased from 5.5 MOM, a difference of 1.1 showings.
- Listings that were both listed and pended in the same month were at 3,872. This represents 31.9% of the new listings for the month and 45.4% of the pended listings. Listings that were both listed and pended in the same month increased from 2,211 MOM.
“While the market remains steady year-over year, we saw upticks from February to March 2026 in very significant categories,” said Karen Kage, CEO, Realcomp II Ltd. “With Spring upon us it appears both sales and pending sales are increasing. At the same time, an influx of new listings is providing more choices for prospective homebuyers.”
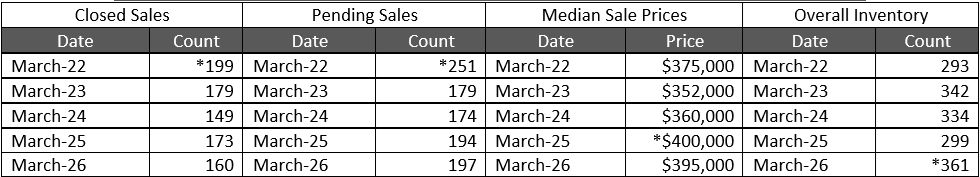
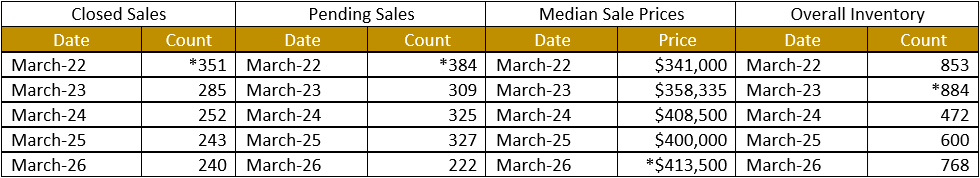
March 5-Year Perspectives -- Residential & Condos Combined -- All MLS
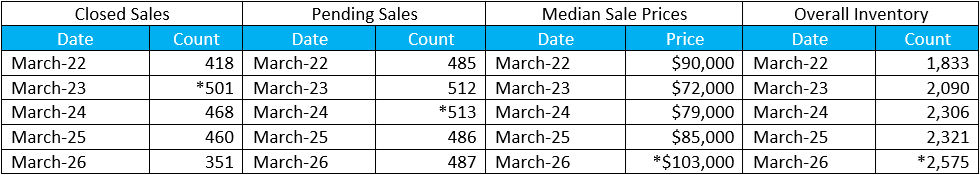
March 5-Year Perspectives -- Residential & Condos Combined – City of Detroit Numbers
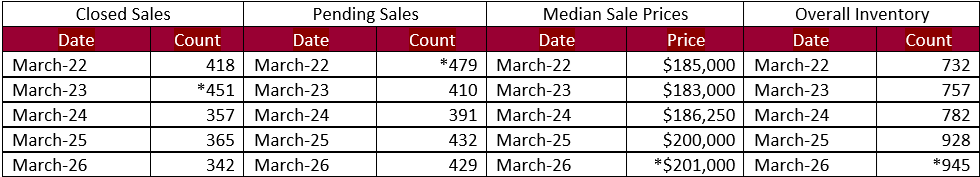
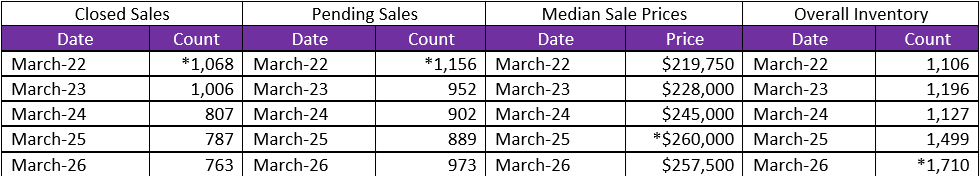
March 5-Year Perspectives -- Residential & Condos Combined -- Genessee County Numbers
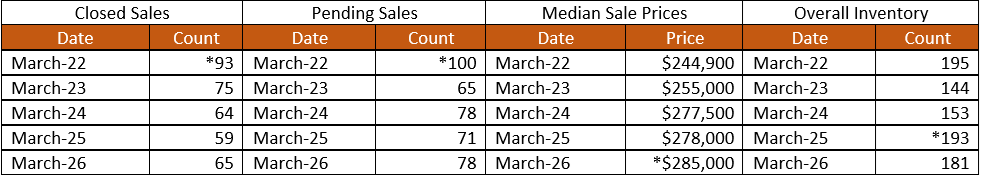
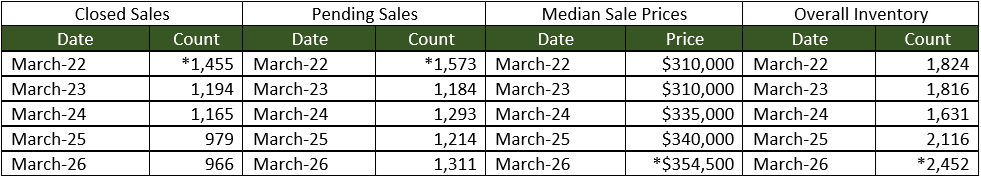
March 5-Year Perspectives -- Residential & Condos Combined -- Lapeer County Numbers
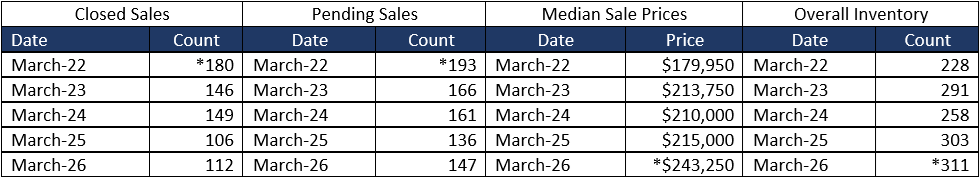
March 5-Year Perspectives -- Residential & Condos Combined -- Livingston County
March 5-Year Perspectives -- Residential & Condos Combined -- Macomb County Numbers
March 5-Year Perspectives -- Residential & Condos Combined -- Oakland County Numbers
March 5-Year Perspectives -- Residential & Condos Combined -- St. Clair County Numbers
March 5-Year Perspectives -- Residential & Condos Combined -- Washtenaw County Numbers
March 5-Year Perspectives -- Residential & Condos Combined -- Wayne County Numbers
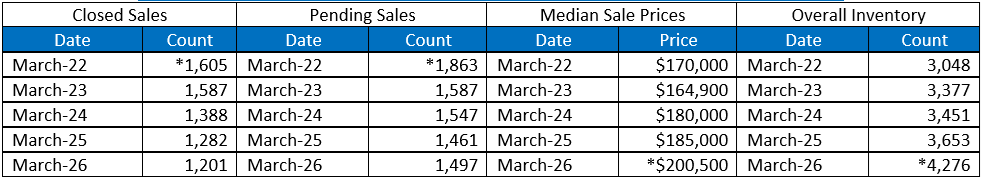
*high points noted with an asterisk.
Note: These numbers represent real estate market activity in the lower part of Michigan. Be sure to contact a REALTOR® for their expertise about local markets. Find a REALTOR® in your market at www.MoveInMichigan.com.
Realcomp Shareholder Boards & Associations of REALTORS®:
- DABOR, Chastity Townsend, AE, 313-278-2220
- DAR, Sharon Armour, EVP, 313-962-1313
- ETAR, Laura VanHouteghen, 810-982-6889
- GPBR, Bob Taylor, CEO, 313-882-8000
- LUTAR, 810-664-0271
- LCAR, Terri Fratarcangeli, EVP, 810-225-1100
- NOCBOR, Patricia Jacobs, EVP, 248-674-4080