
National Real Estate Commentary
U.S. existing-home sales dipped 0.5% month-over-month and 2.0% year-over-year to a seasonally adjusted annual rate of 4.00 million units, according to the National Association of REALTORS® (NAR). Sales increased in the Midwest, decreased in the West and Northeast, and were unchanged in the South. Year-over-year, sales were down in every region except the Northeast.
There were 1.45 million units actively for sale heading into May, a 9.0% increase from the previous month and a 20.8% improvement from the same time last year, for a 4.4-month supply at the current sales pace, according to NAR. The median existing-home price edged up 1.8% year-over-year to $414,000 as of last measure, the 22nd consecutive month of annual price increases and a new record high for the month.
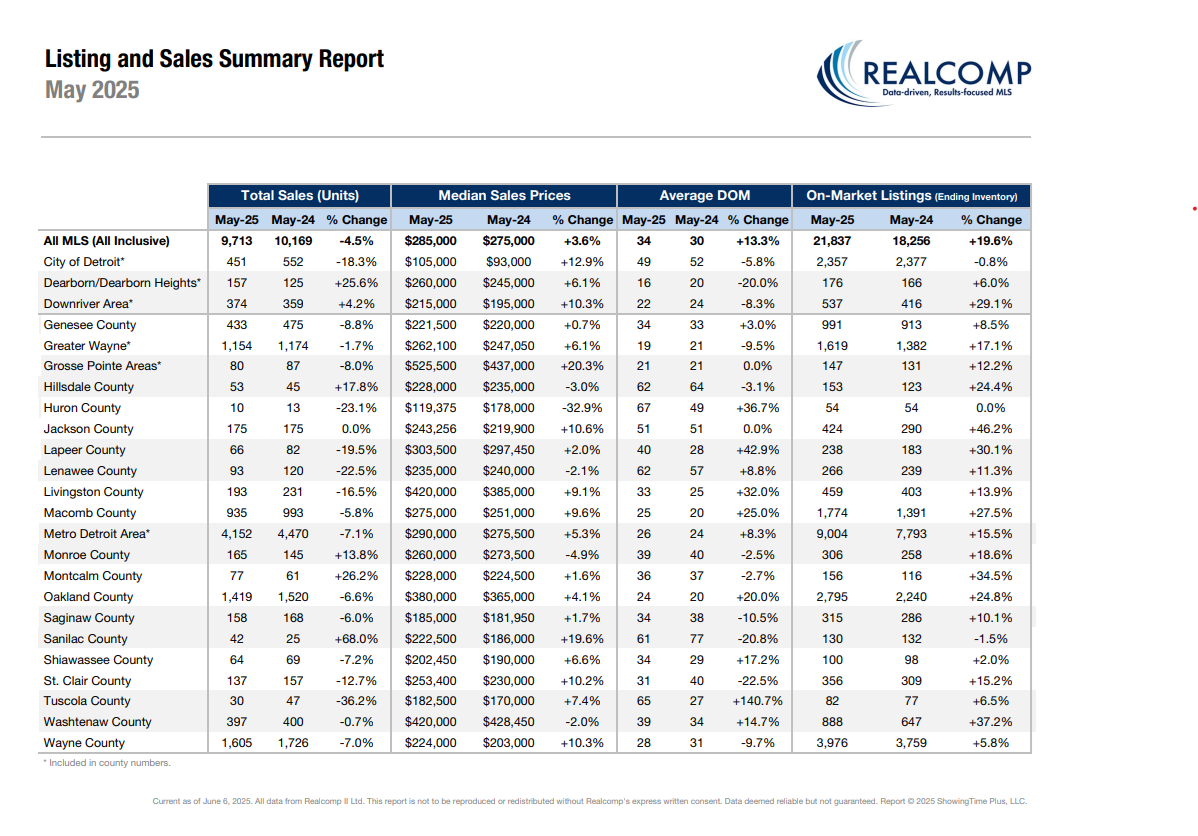
May-Local Activity
Closed Sales decreased 4.2 percent for Residential homes and 6.5 percent for Condo homes. Pending Sales decreased 0.7 percent for Residential homes and 5.3 percent for Condo homes. Inventory increased 18.6 percent for Residential homes and 26.1 percent for Condo homes.
The Median Sales Price increased 4.4 percent to $287,000 for Residential homes but decreased 1.1 percent to $275,000 for Condo homes. Days on Market increased 6.5 percent for Residential homes and 41.4 percent for Condo homes. Months-Supply of Inventory increased 20.0 percent for Residential homes and 31.8 percent for Condo homes.
“May was an interesting month as we watched the median sale price for the entire MLS rise to an all�time high which is good for sellers” said Karen S. Kage, Realcomp CEO. Additionally, with inventory rising as we move into summer, we are excited about the opportunities available to buyers.”
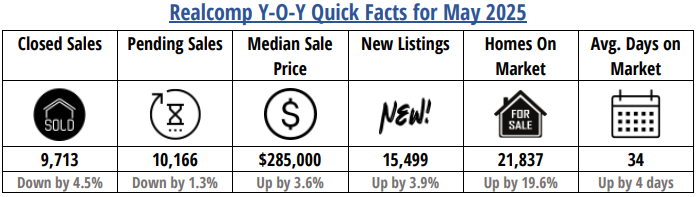
May Y-O-Y Comparison -- Residential & Condos Combined -- All MLS
- New Listings increased by 3.9% from 14,915 to 15,499 Year-Over-Year (YOY). New Listings increased 11.3% from 13,925 Month-Over-Month (MOM).
- Pending Sales decreased by 1.3% from 10,303 to 10,166 YOY. Pending Sales increased from 9,154 MOM, an increase of 11.6%
- Closed Sales decreased by 4.5% from 10,169 to 9,713 YOY. Closed Sales increased from 8,194 MOM, an increase of 18.5%.
- Average Days on Market (DOM) increased by 4 days from 30 to 34 YOY. Average Days on Market decreased from 39 days MOM.
- Median Sale Price increased by 3.6% from $275,000 to $285,000 YOY. Median Sale Price increased from $275,000 MOM.
- Percentage of Last List Price Received decreased slightly by .6% from 100.4% to 99.8% YOY. Percentage of Last List Price Received increased from 99.3% MOM.
- Inventory of Homes for Sale increased by 19.6% from 18,256 to 21,837 YOY. Inventory of Homes for Sale increased from 19,544 MOM.
- Month’s Supply of Inventory increased by 19.0% from 2.1 to 2.5 YOY. Month’s Supply of Inventory increased from 2.2 MOM.
- Average Showings per Home decreased from 10.3 to 6.9 YOY. Average Showings decreased from 7.1 MOM.
- Listings that were both listed and pended in the same month were at 4,979. This represents 32.1% of the new listings for the month and 48.9% of the pended listings. Listings that were both listed and pended in the same month increased from 4,750 MOM.
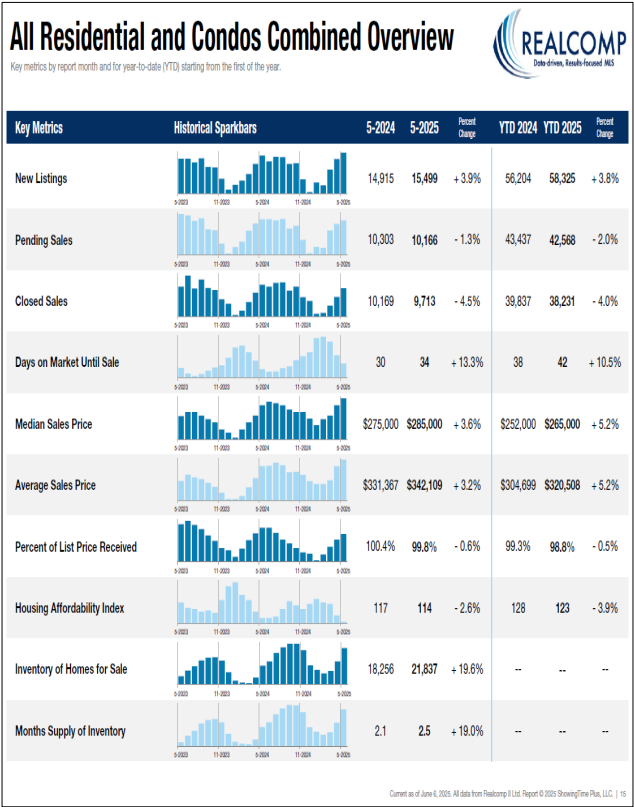
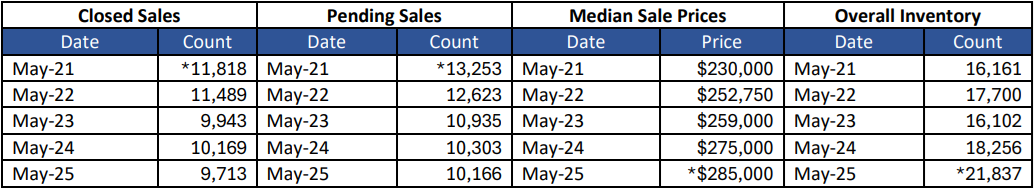
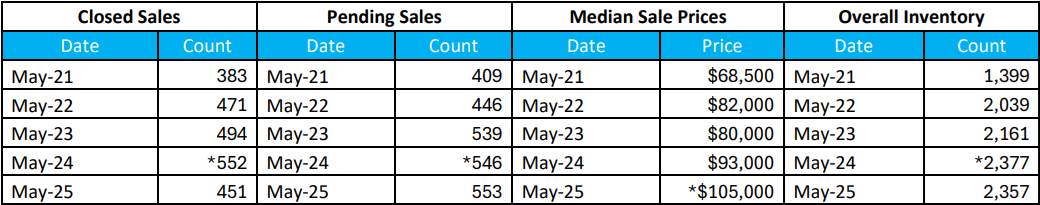
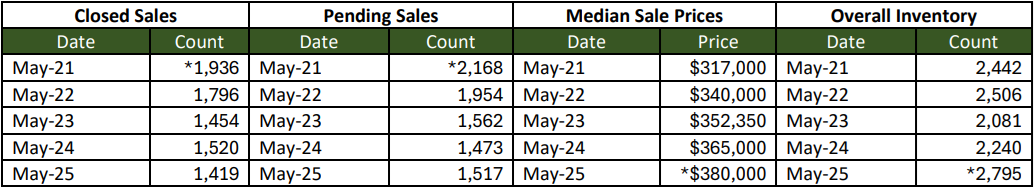
May 5-Year Perspectives -- Residential & Condos Combined -- All MLS
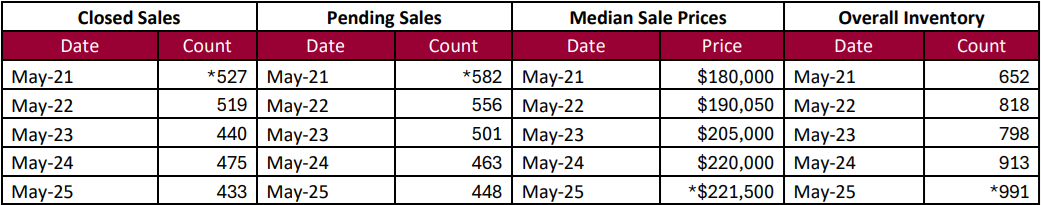
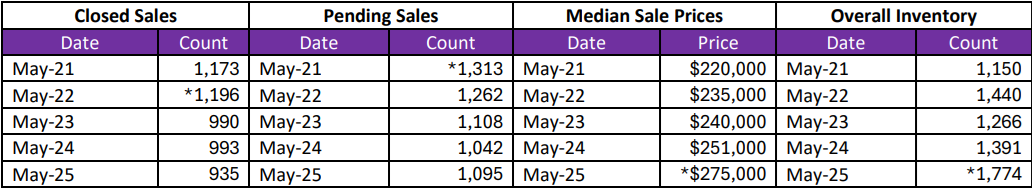
May 5-Year Perspectives -- Residential & Condos Combined – City of Detroit Numbers
May 5-Year Perspectives -- Residential & Condos Combined -- Genessee County Numbers
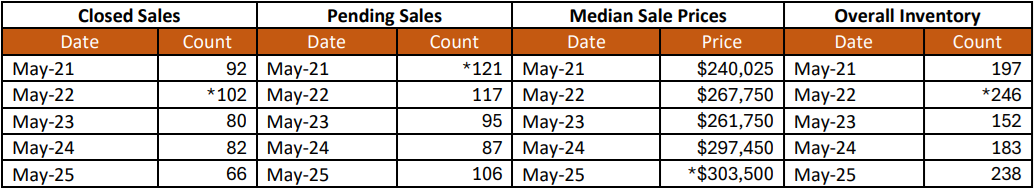
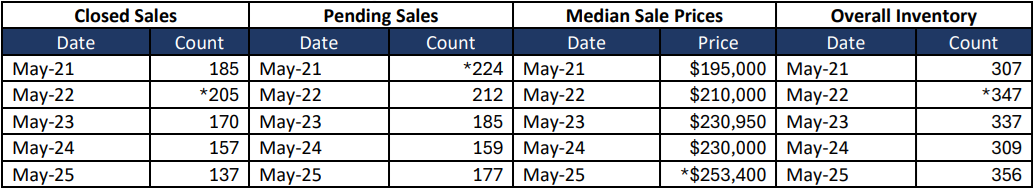
May 5-Year Perspectives -- Residential & Condos Combined -- Lapeer County Numbers
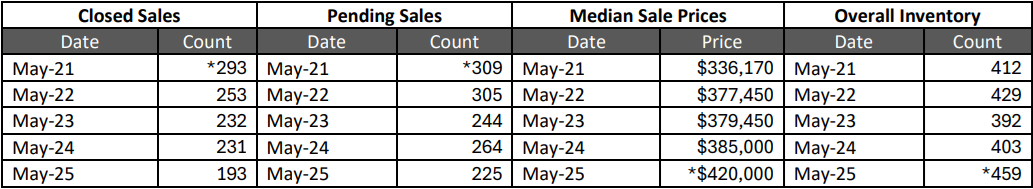
May 5-Year Perspectives -- Residential & Condos Combined -- Livingston County
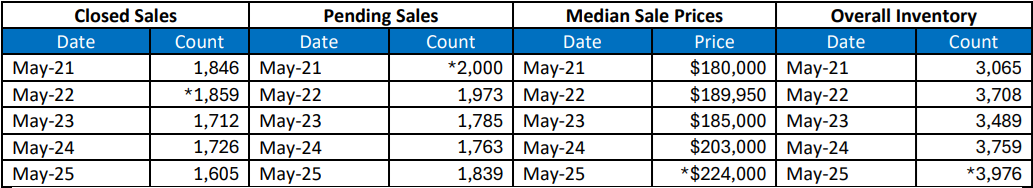
May 5-Year Perspectives -- Residential & Condos Combined -- Macomb County Numbers
May 5-Year Perspectives -- Residential & Condos Combined -- Oakland County Numbers
May 5-Year Perspectives -- Residential & Condos Combined -- St. Clair County Numbers
May 5-Year Perspectives -- Residential & Condos Combined -- Wayne County Numbers
*high points noted with an asterisk.
Note: These numbers represent real estate market activity in the lower part of Michigan. Be sure to contact a REALTOR® for their expertise about local markets. Find a REALTOR® in your market at www.MoveInMichigan.com.
Realcomp Shareholder Boards & Associations of REALTORS®:
- DABOR, Andrea Kuentz, CEO, 313-278-2220
- DAR, Sharon Armour, EVP, 313-962-1313
- ETAR, Laura VanHouteghen, 810-982-6889
- GPBR, Bob Taylor, CEO, 313-882-8000
- LUTAR, 810-664-0271
- LCAR, Terri Fratarcangeli, EVP, 810-225-1100
- NOCBOR, Patricia Jacobs, EVP, 248-674-4080