
National Real Estate Commentary
U.S. sales of existing homes rose 1.2% from the previous month to a seasonally adjusted annual rate of 4.10 million, according to the National Association of REALTORS® (NAR), as buyers took advantage of lower mortgage rates this fall. Sales increased in the Midwest and South, held steady in the Northeast, and edged down in the West. Year-over-year, sales were up 1.7%, with gains in the Northeast, Midwest, and South, while the West posted a decline.
Nationally, inventory dipped 0.7% month-over-month but rose 10.9% year-over-year, totaling 1.52 million units, according to NAR. At the current sales pace, supply stands at 4.4 months, slightly below last month’s level but higher than the 4.1 months recorded a year ago. Supported by modest inventory levels, prices continue to rise, with the national median existing-home price increasing 2.1% year-over-year to $415,200, marking 28 consecutive months of annual gains.
November-Local Activity
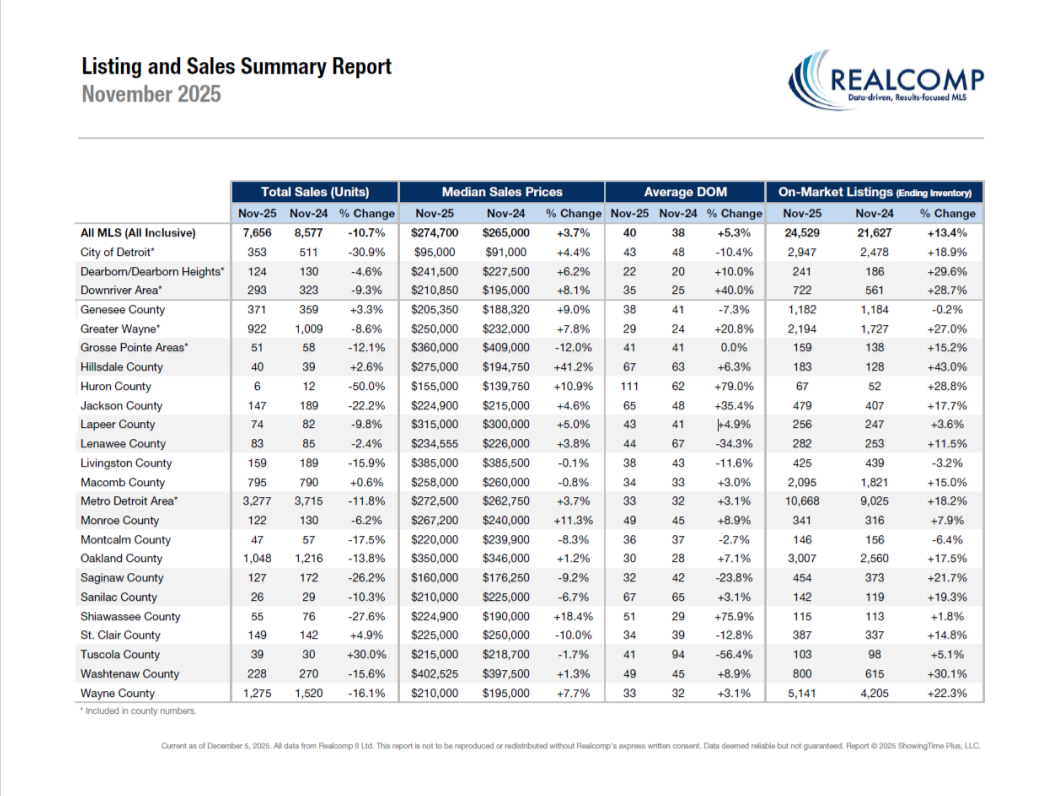
Closed Sales decreased 10.4 percent for Residential homes and 13.0 percent for Condo homes. Pending Sales decreased 7.7 percent for Residential homes and 9.3 percent for Condo homes. Inventory increased 12.7 percent for Residential homes and 18.3 percent for Condo homes.
The Median Sales Price increased 3.8 percent to $275,000 for Residential homes and remained flat at $265,000 for Condo homes. Days on Market increased 2.6 percent for Residential homes but decreased 4.5 percent for Condo homes. Months Supply of Inventory increased 12.5 percent for Residential homes and 19.2 percent for Condo homes.
November Comparisons – Res & Condo Combined - All MLS
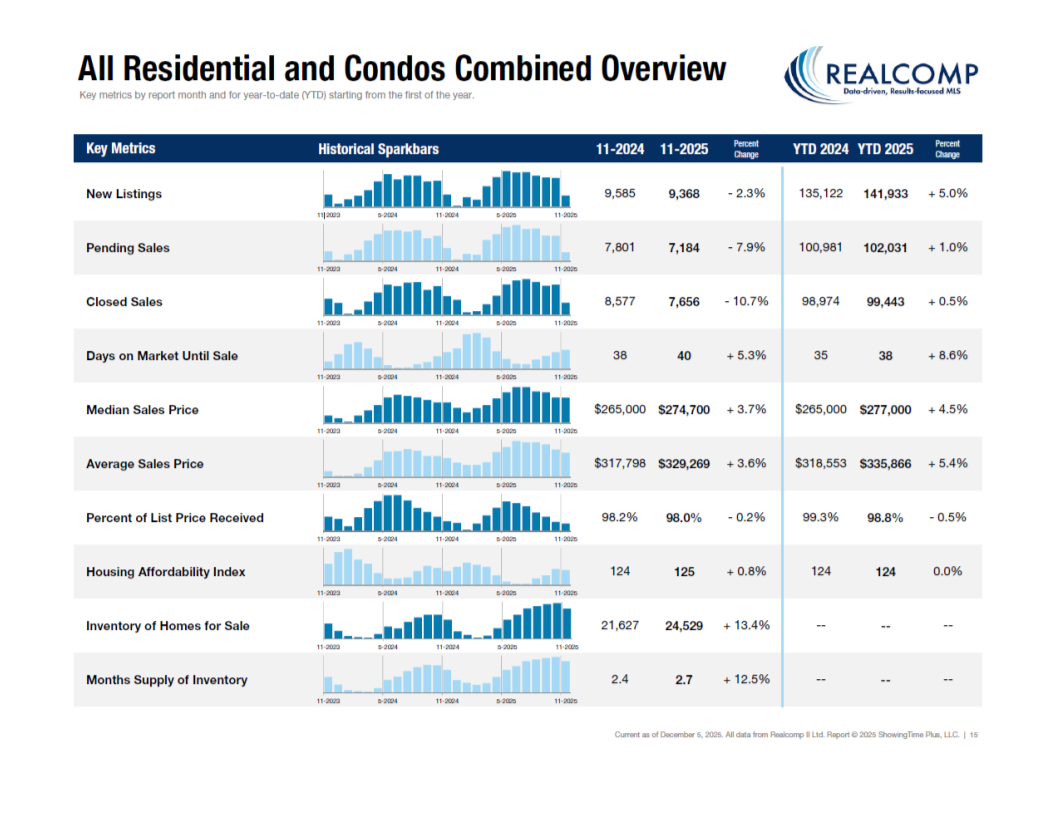
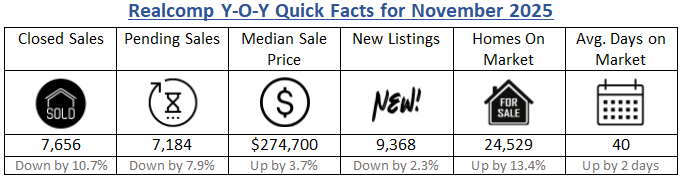
- New Listings decreased by 2.3% from 9,585 to 9,368 Year-Over-Year (YOY). New Listings decreased from 13,907 Month-Over-Month (MOM), a decrease of about 32.6%.
- Pending Sales decreased by 7.9% from 7,801 to 7,184 YOY. Pending sales decreased from 9,027 MOM, a decrease of 20.4%.
- Closed Sales decreased by 10.7% from 8,577 to 7,656 YOY. Closed sales decreased from 9,885 MOM, a decrease of 22.5%.
- Average Days on Market (DOM) increased by 2 days from 38 to 40 YOY. Average Days on Market increased from 38 days MOM.
- Median Sale Price increased by 3.7% from $265,000 to $274,700 YOY. Median Sale price decreased from $275,000 MOM, a decrease of 0.1%.
- Percentage of Last List Price Received decreased slightly by .2% from 98.2% to 98.0% YOY. Percentage of Last List Price Received decreased by 0.1%, MOM.
- Inventory of Homes for Sale increased by 13.4% from 21,627 to 24,529 YOY. Inventory of Homes for Sale decreased from 26,511 MOM, a decrease of 7.5%.
- Month’s Supply of Inventory increased by 12.5% from 2.4 to 2.7 YOY. Month’s Supply of Inventory decreased 6.9% from 2.9, MOM.
- Average Showings per Home decreased from 6.3 to 4.2 YOY. Average Showings decreased from 4.7 MOM, a difference of .5 showings.
- Listings that were both listed and pended in the same month were at 2,214. This represents 23.6% of the new listings for the month and 30.8% of the pended listings. Listings that were both listed and pended in the same month decreased from 3,412 MOM.
“More homes entered the market in November, year-over-year, than in any November in the past five years,” said Karen Kage, CEO, Realcomp II LTD. “Higher inventory levels make the residential real estate environment ripe for activity in the days ahead and beyond the holiday season.”
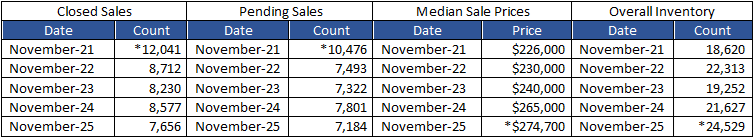
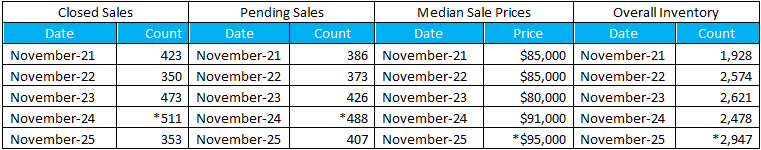
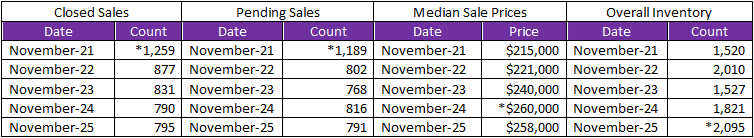
November 5-Year Perspectives -- Residential & Condos Combined -- All MLS
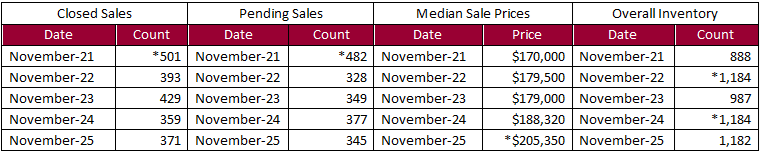
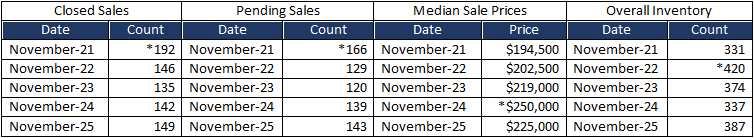
November 5-Year Perspectives -- Residential & Condos Combined – City of Detroit Numbers
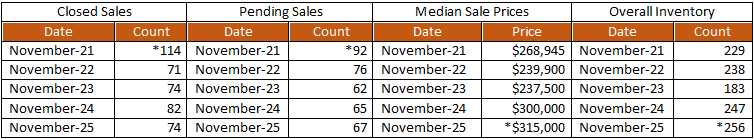
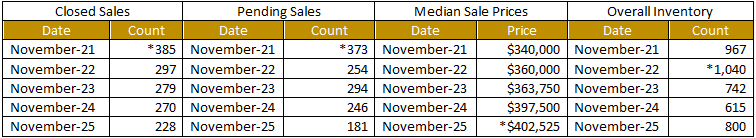
November 5-Year Perspectives -- Residential & Condos Combined -- Genessee County Numbers
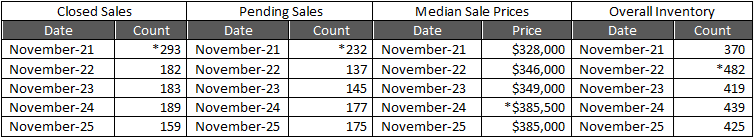
November 5-Year Perspectives -- Residential & Condos Combined -- Lapeer County Numbers
November 5-Year Perspectives -- Residential & Condos Combined -- Livingston County
November 5-Year Perspectives -- Residential & Condos Combined -- Macomb County Numbers
November 5-Year Perspectives -- Residential & Condos Combined -- Oakland County Numbers

November 5-Year Perspectives -- Residential & Condos Combined -- St. Clair County Numbers
November 5-Year Perspectives -- Residential & Condos Combined -- Washtenaw County Numbers
November 5-Year Perspectives -- Residential & Condos Combined -- Wayne County Numbers

*high points noted with an asterisk.
Note: These numbers represent real estate market activity in the lower part of Michigan. Be sure to contact a REALTOR® for their expertise about local markets. Find a REALTOR® in your market at www.MoveInMichigan.com.
Realcomp Shareholder Boards & Associations of REALTORS®:
- DABOR, Andrea Kuentz, CEO, 313-278-2220
- DAR, Sharon Armour, EVP, 313-962-1313
- ETAR, Laura VanHouteghen, 810-982-6889
- GPBR, Bob Taylor, CEO, 313-882-8000
- LUTAR, 810-664-0271
- LCAR, Terri Fratarcangeli, EVP, 810-225-1100
- NOCBOR, Patricia Jacobs, EVP, 248-674-4080