How to Display Map Layer Information for Listings


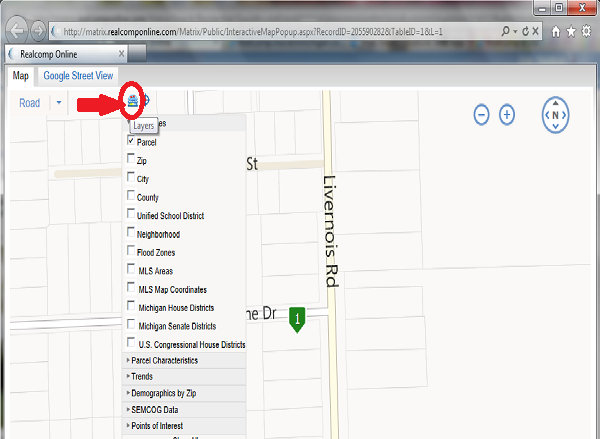
When viewing the map associated with a listing, click the Layers icon (shown circled above). When you position your cursor over the icon, the layers label will appear. Upon clicking the icon, all of the applicable "boundaries" map layer choices will be shown. Simply click whichever ones (i.e. parcel, zip, city, county, flood zones, MLS areas, etc.) you'd like to display.


 Last Modified:  Wednesday, December 04, 2013
December 2013

How to Display Map Layer Information for Listings

Instructions for displaying map layer information for listings

How to Generate a 1004MC Report

Instructions for generating a 1004MC Report

Realcomp Dashboard Debuts

Realcomp Dashboard Debuts

Update on Bathroom and Lavatory Dimensions Requirement

Update on Bathroom and Lavatory Dimensions Requirement

Using Showing Assist from RCO3®

Showing Assist Agent Configuration and Appointment Making

Which Report Contains Averages, Medians, Lows, Highs, and DOM?

The CMA 1-Line Report includes these figures.